Market Indexes and Curves
How published market data is organised in the OpenTRMS Workbench — index metadata, dependencies and the grid points a curve is built from.
Transcript1m 17s
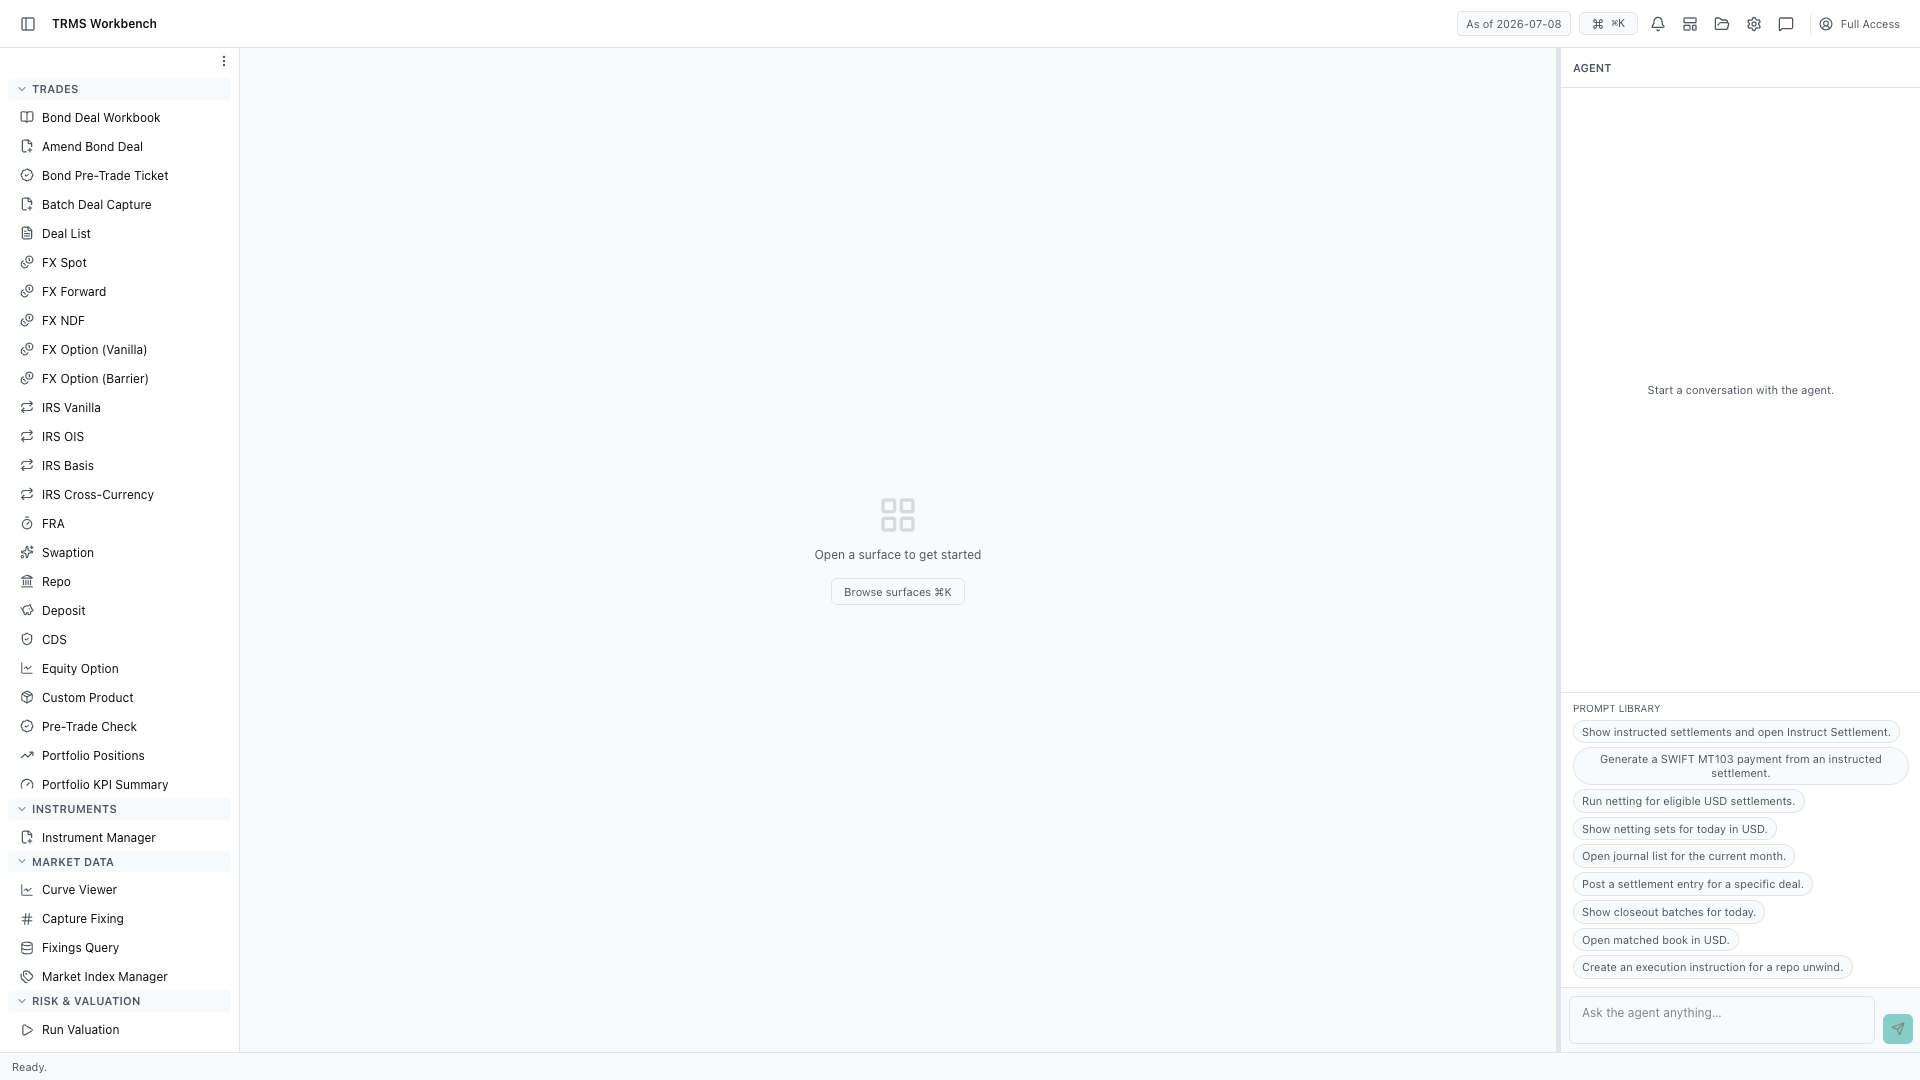
In this walkthrough we'll see how a market curve is defined, and what it depends on, in the OpenTRMS Workbench.
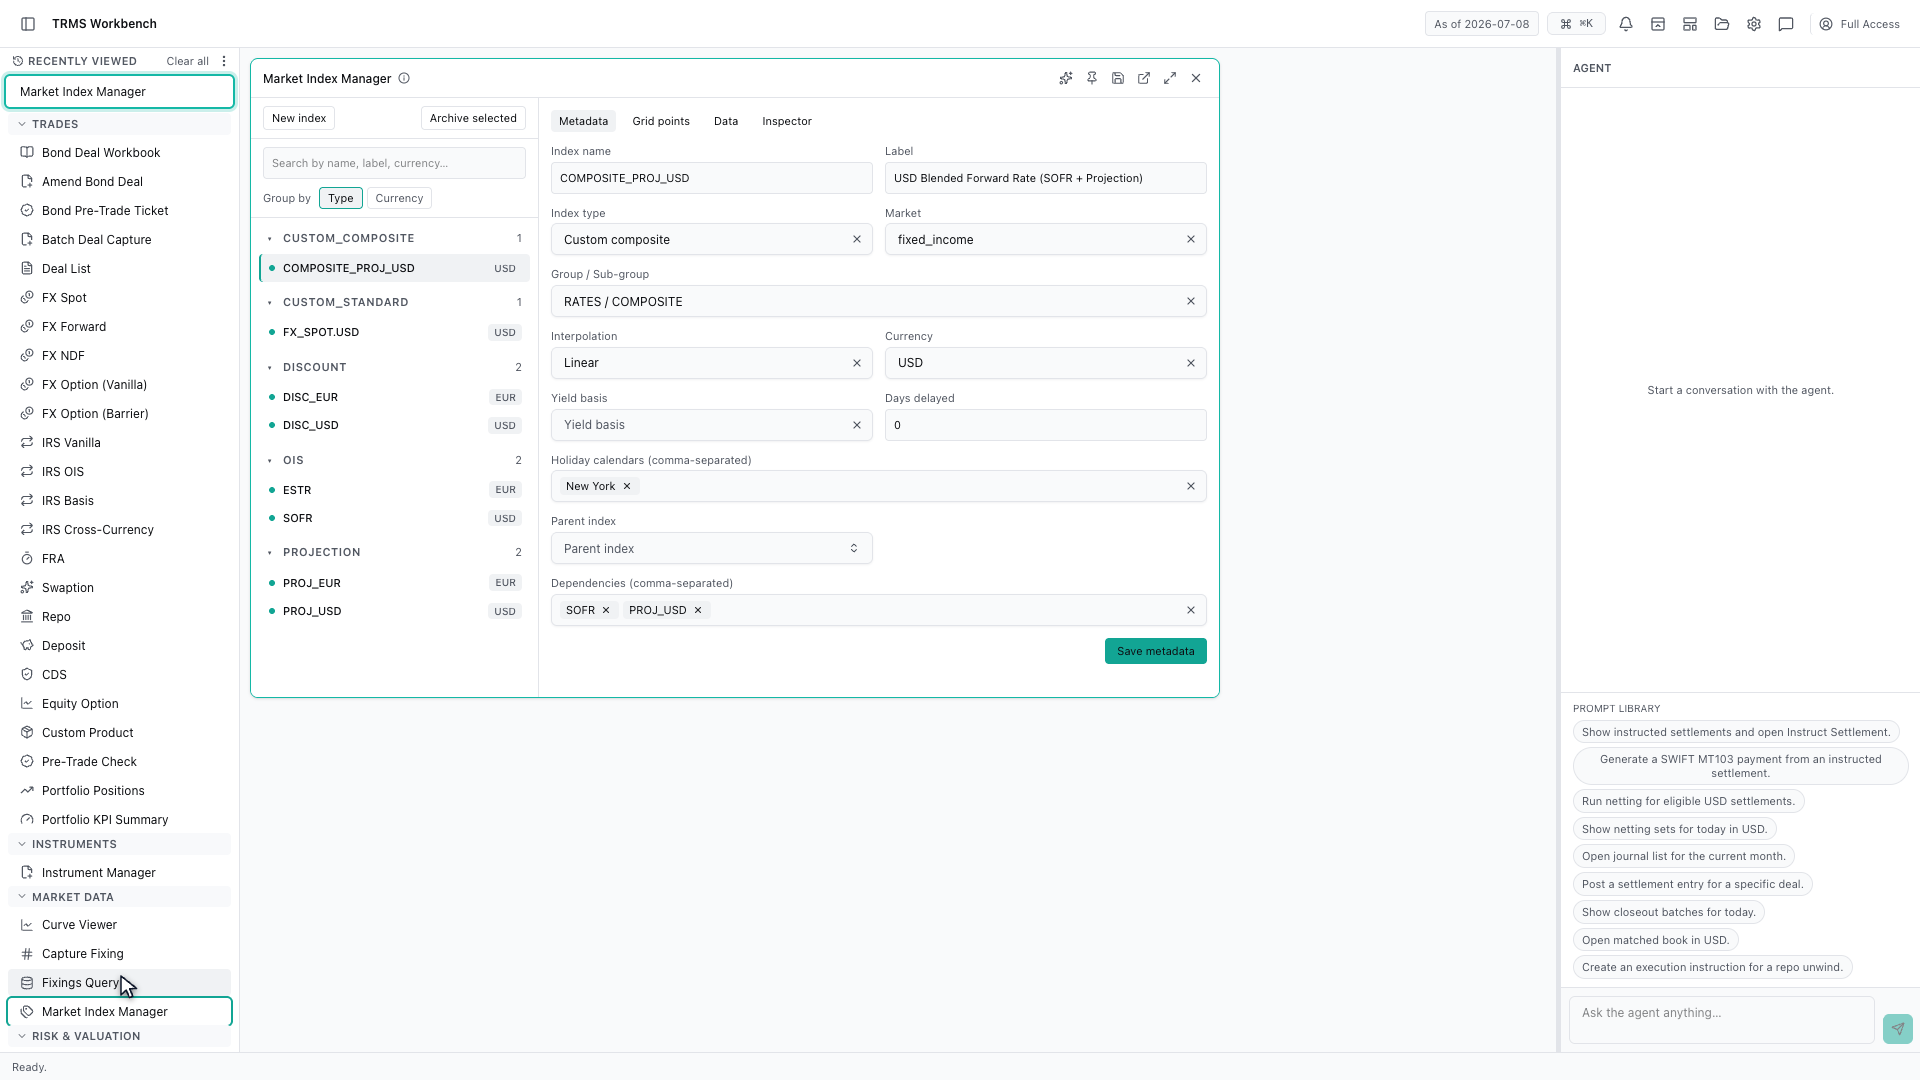
The Curve Viewer showed a curve. The Market Index Manager is where that curve is defined in the first place.
Indexes are catalogued by type. Discount curves, overnight index curves, and composites built from others, each with its own currency.
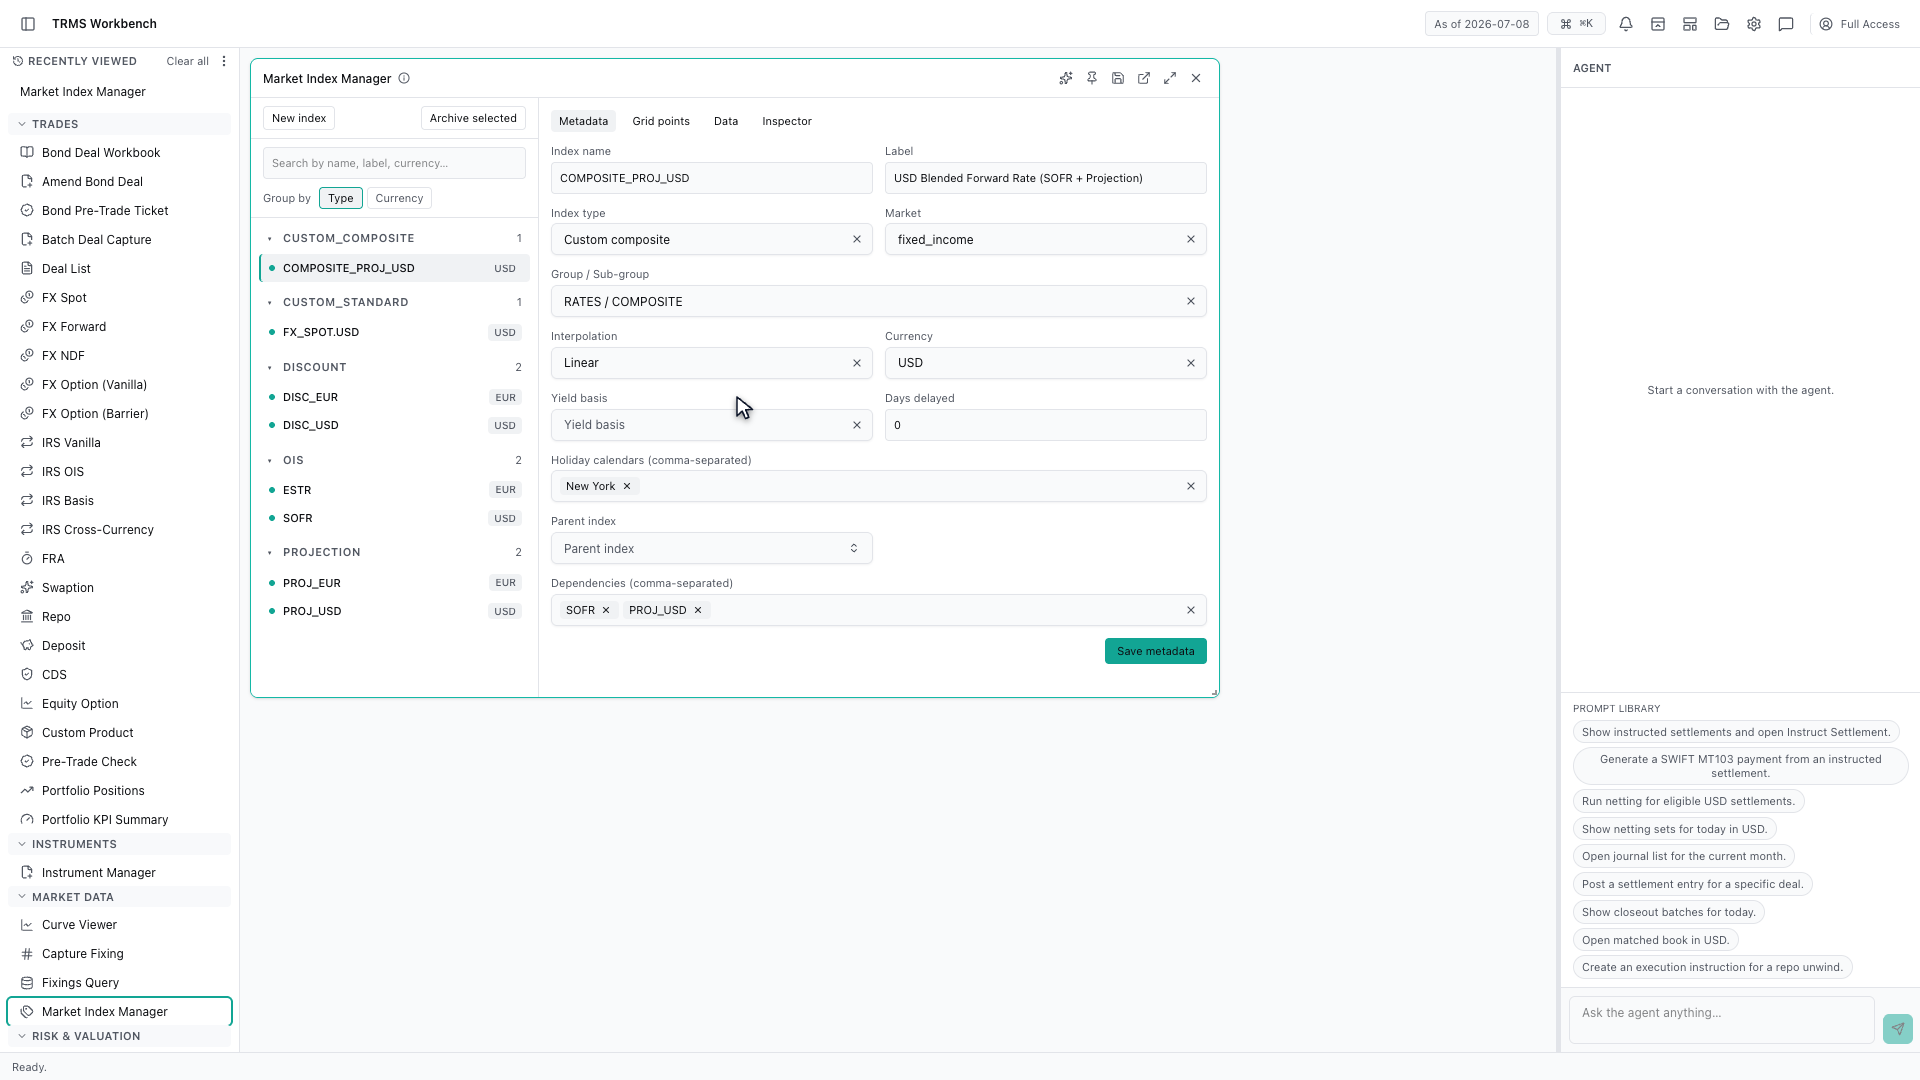
An index carries metadata rather than numbers. The market it belongs to, the group it sits in, and how values between published points are interpolated.
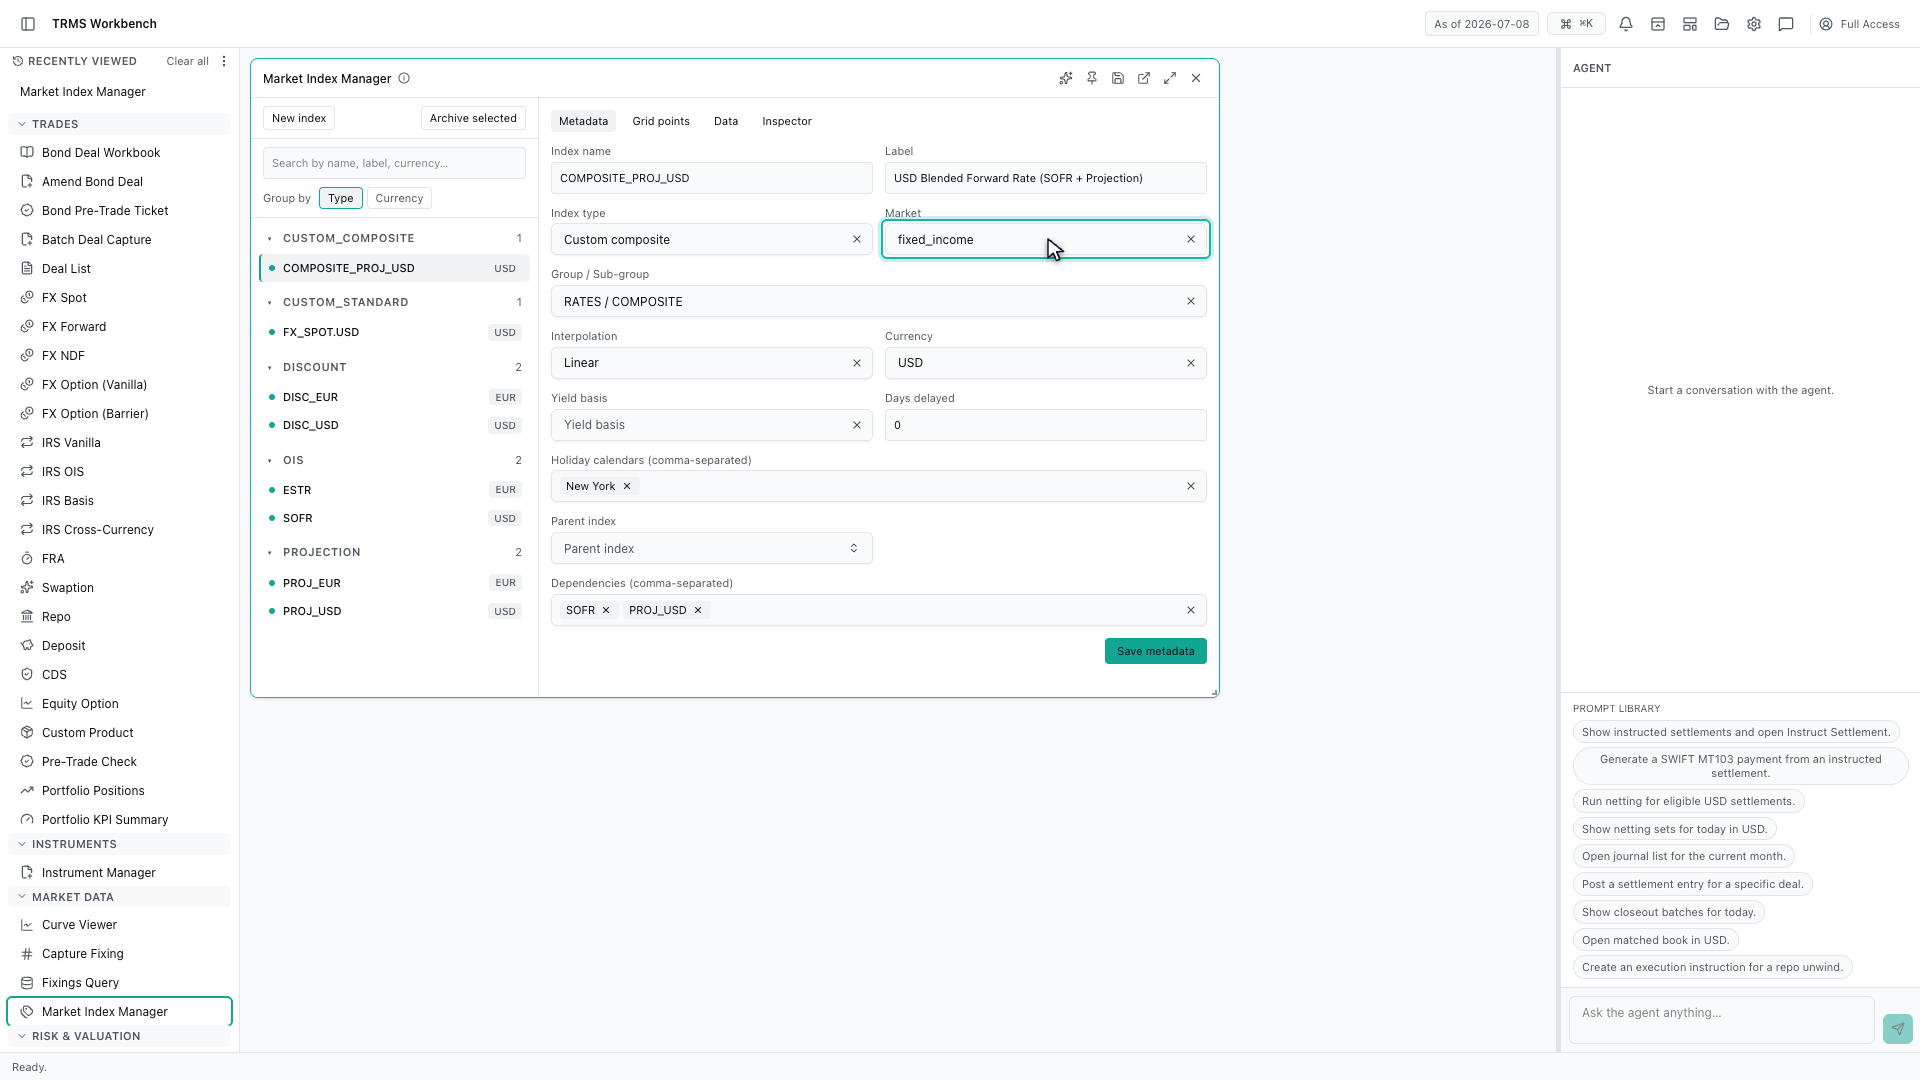
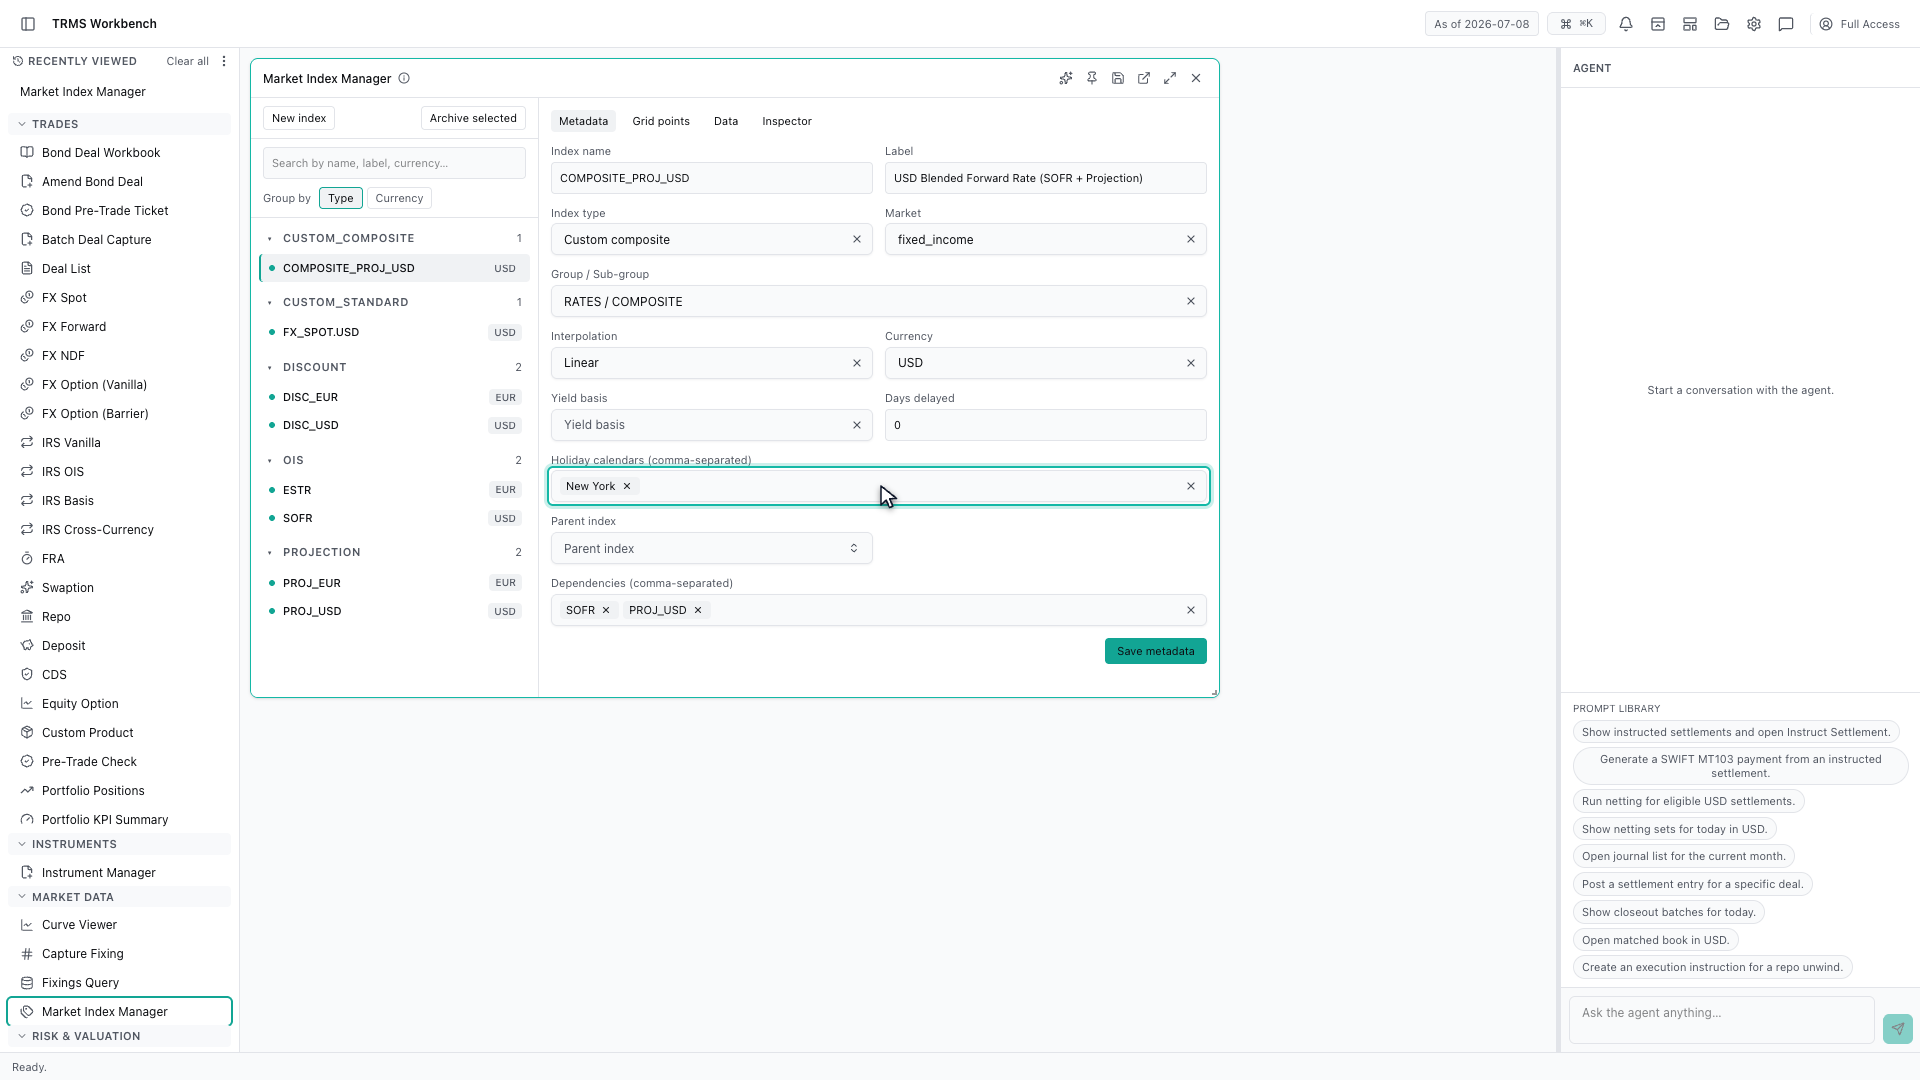
Holiday calendars attach here, which is how a curve knows which days are good business days for the currency it prices.
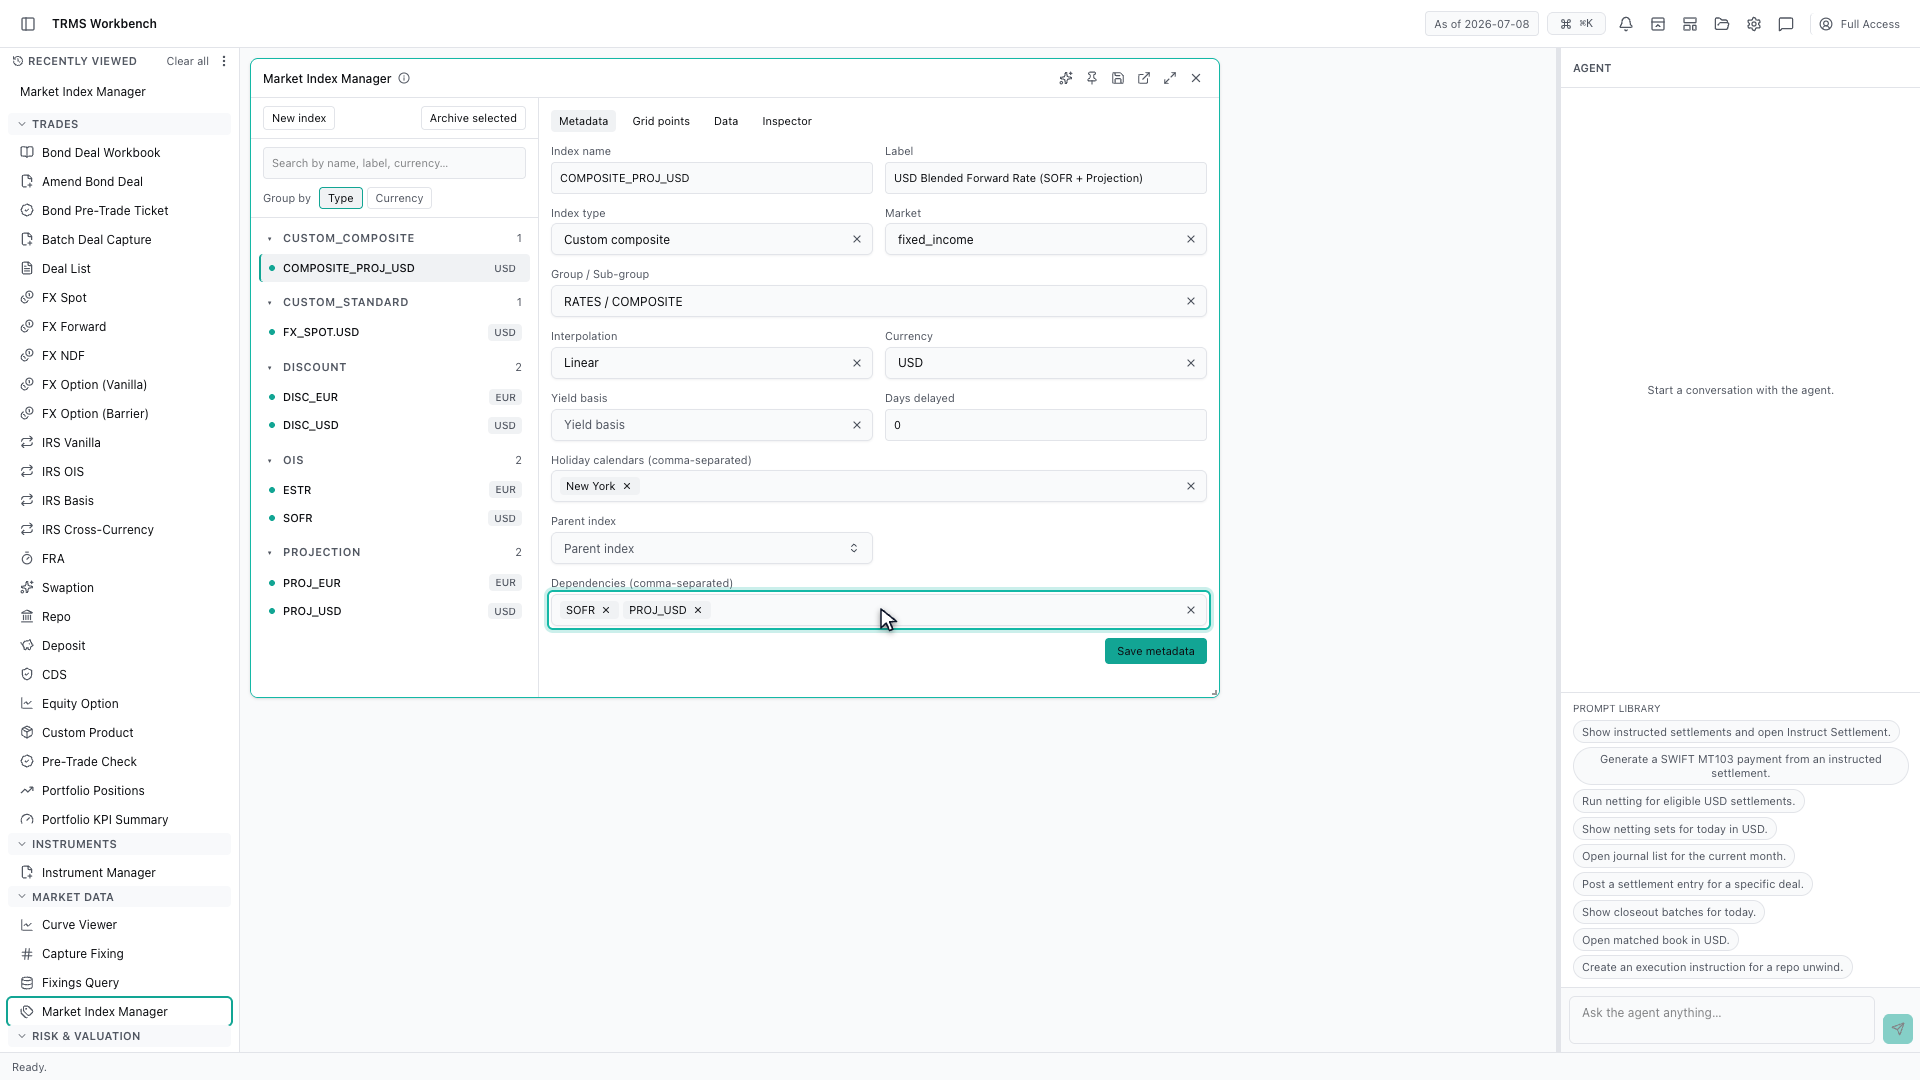
Dependencies are the interesting part. A composite index is built from others, so changing one of those changes everything downstream of it.
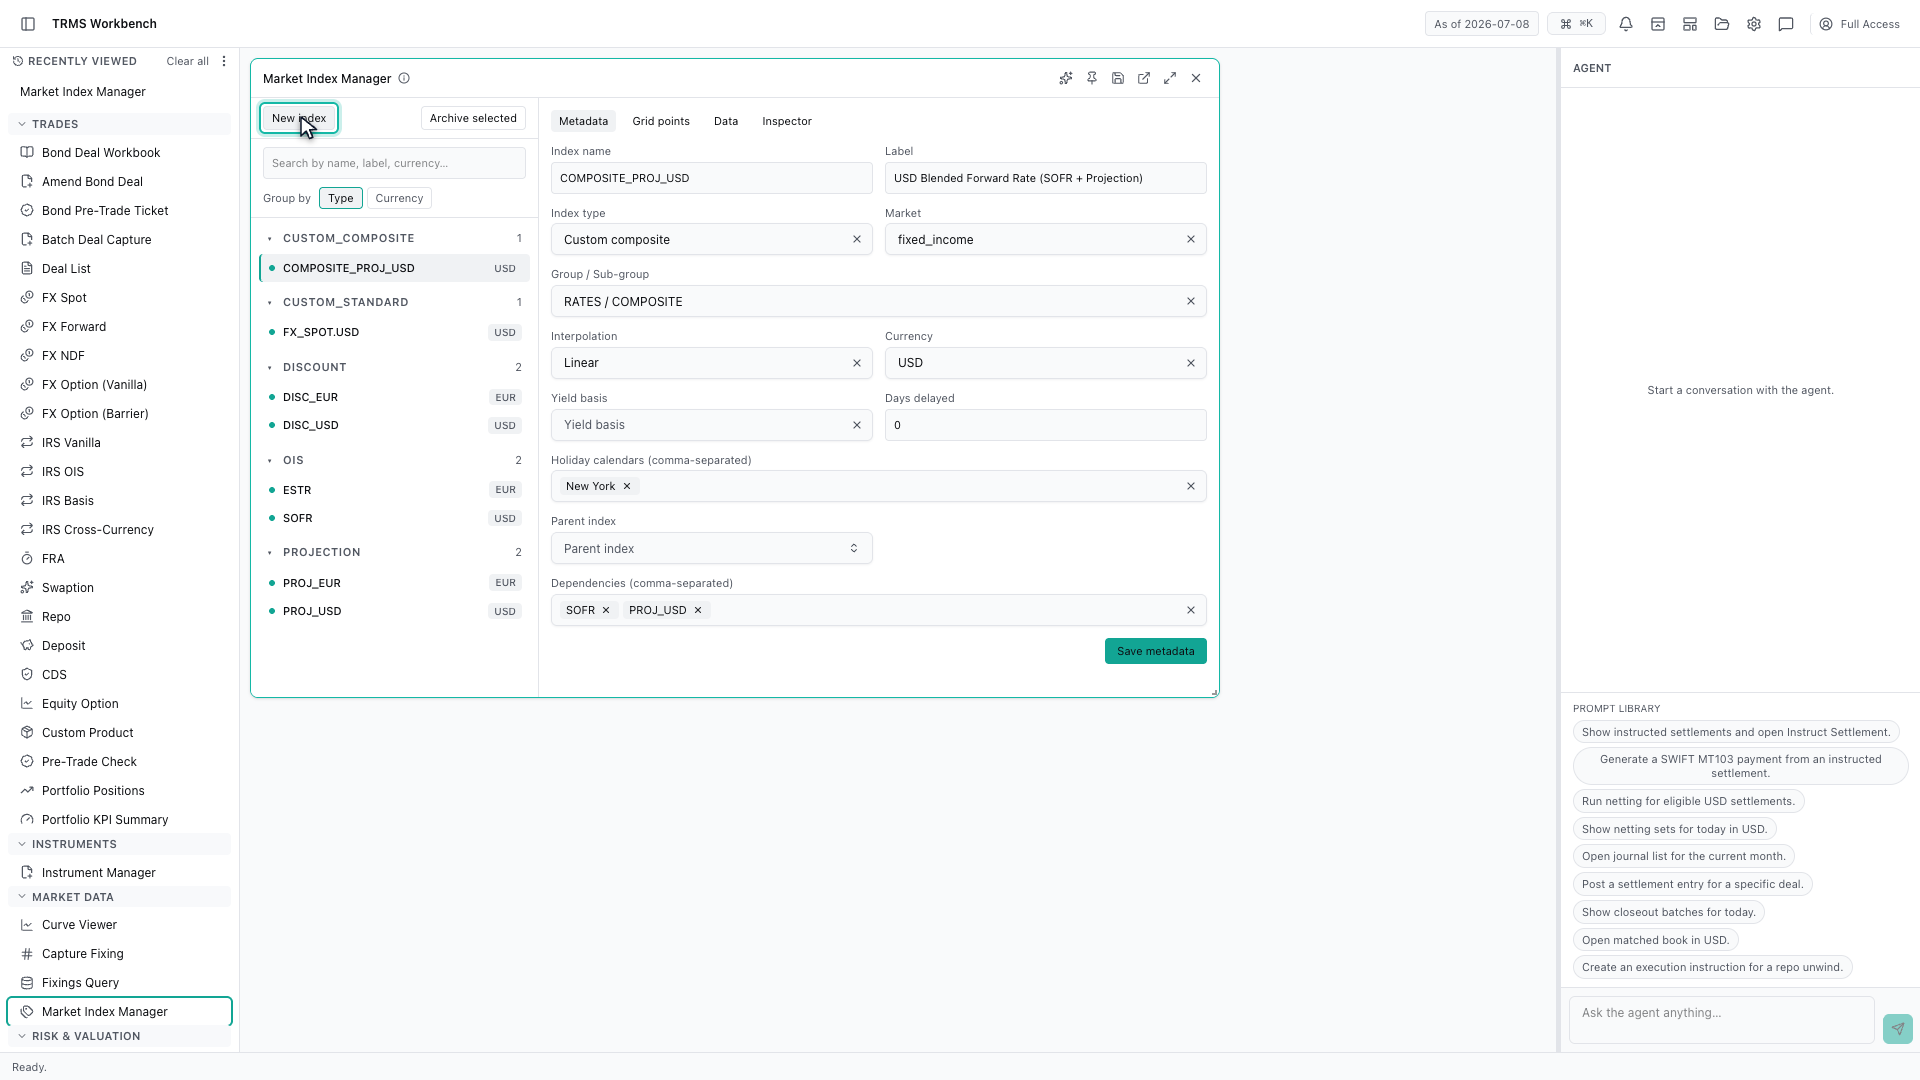
New index adds a definition to the catalogue. Once it exists and has grid point data published against it, it becomes selectable in the Curve Viewer and usable by valuations.
That completes Market Indexes and Curves. Every surface shown here can also be opened from the agent panel on the right, by asking for it in plain English.
1. Open the Workbench
In this walkthrough we'll see how a market curve is defined, and what it depends on, in the OpenTRMS Workbench.
2. Open the Market Index Manager
The Curve Viewer showed a curve. The Market Index Manager is where that curve is defined in the first place.
3. The index catalogue
Indexes are catalogued by type. Discount curves, overnight index curves, and composites built from others, each with its own currency.
4. Index metadata
An index carries metadata rather than numbers. The market it belongs to, the group it sits in, and how values between published points are interpolated.
5. Calendars attach to the index
Holiday calendars attach here, which is how a curve knows which days are good business days for the currency it prices.
6. Indexes depend on other indexes
Dependencies are the interesting part. A composite index is built from others, so changing one of those changes everything downstream of it.
7. Adding a new index
New index adds a definition to the catalogue. Once it exists and has grid point data published against it, it becomes selectable in the Curve Viewer and usable by valuations.
8. Next steps
That completes Market Indexes and Curves. Every surface shown here can also be opened from the agent panel on the right, by asking for it in plain English.