Positions and Portfolio KPIs
How to read aggregated positions in the OpenTRMS Workbench — grouping by currency or asset class — and the per-currency KPI summary built from them.
Transcript1m 57s
In this walkthrough we'll read your positions, group them, and see the portfolio summary, in the OpenTRMS Workbench.
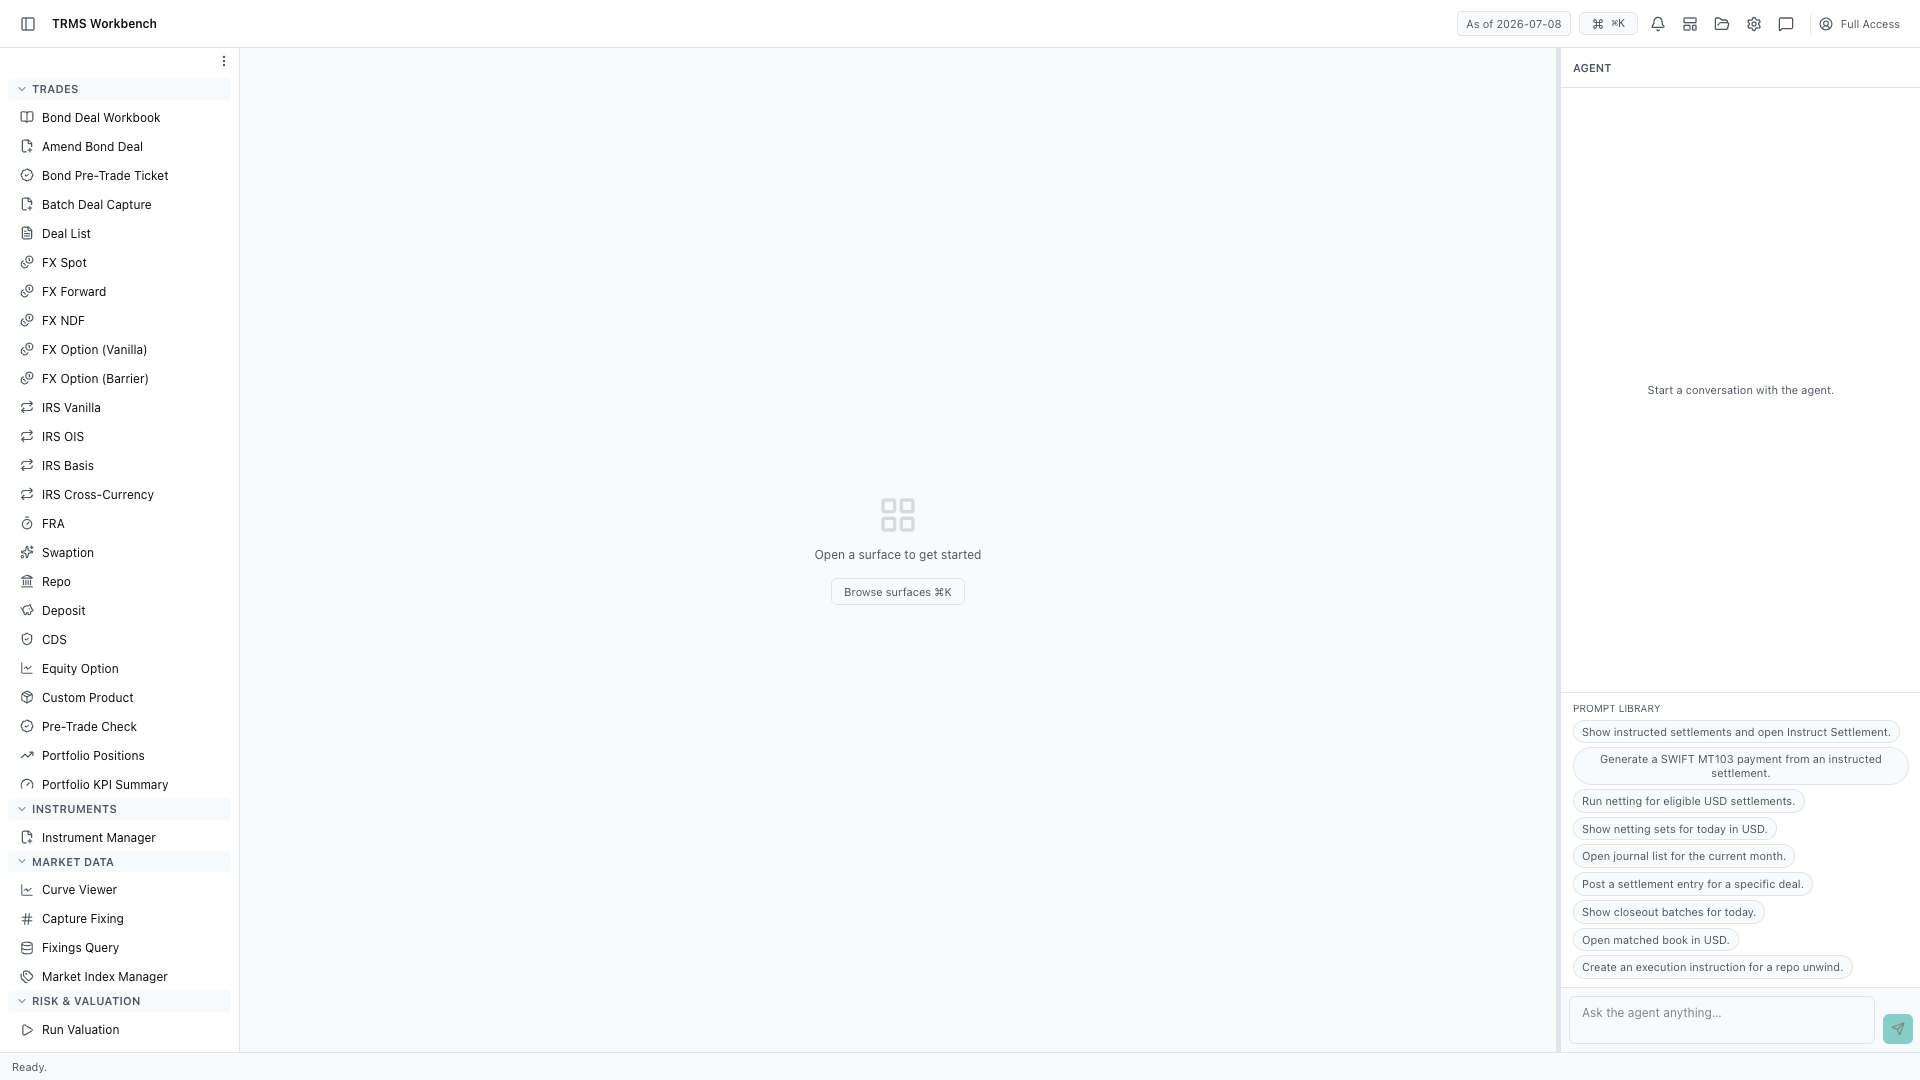
Portfolio Positions is not a list of trades. It is what those trades add up to — one row per instrument you hold, aggregated across books.
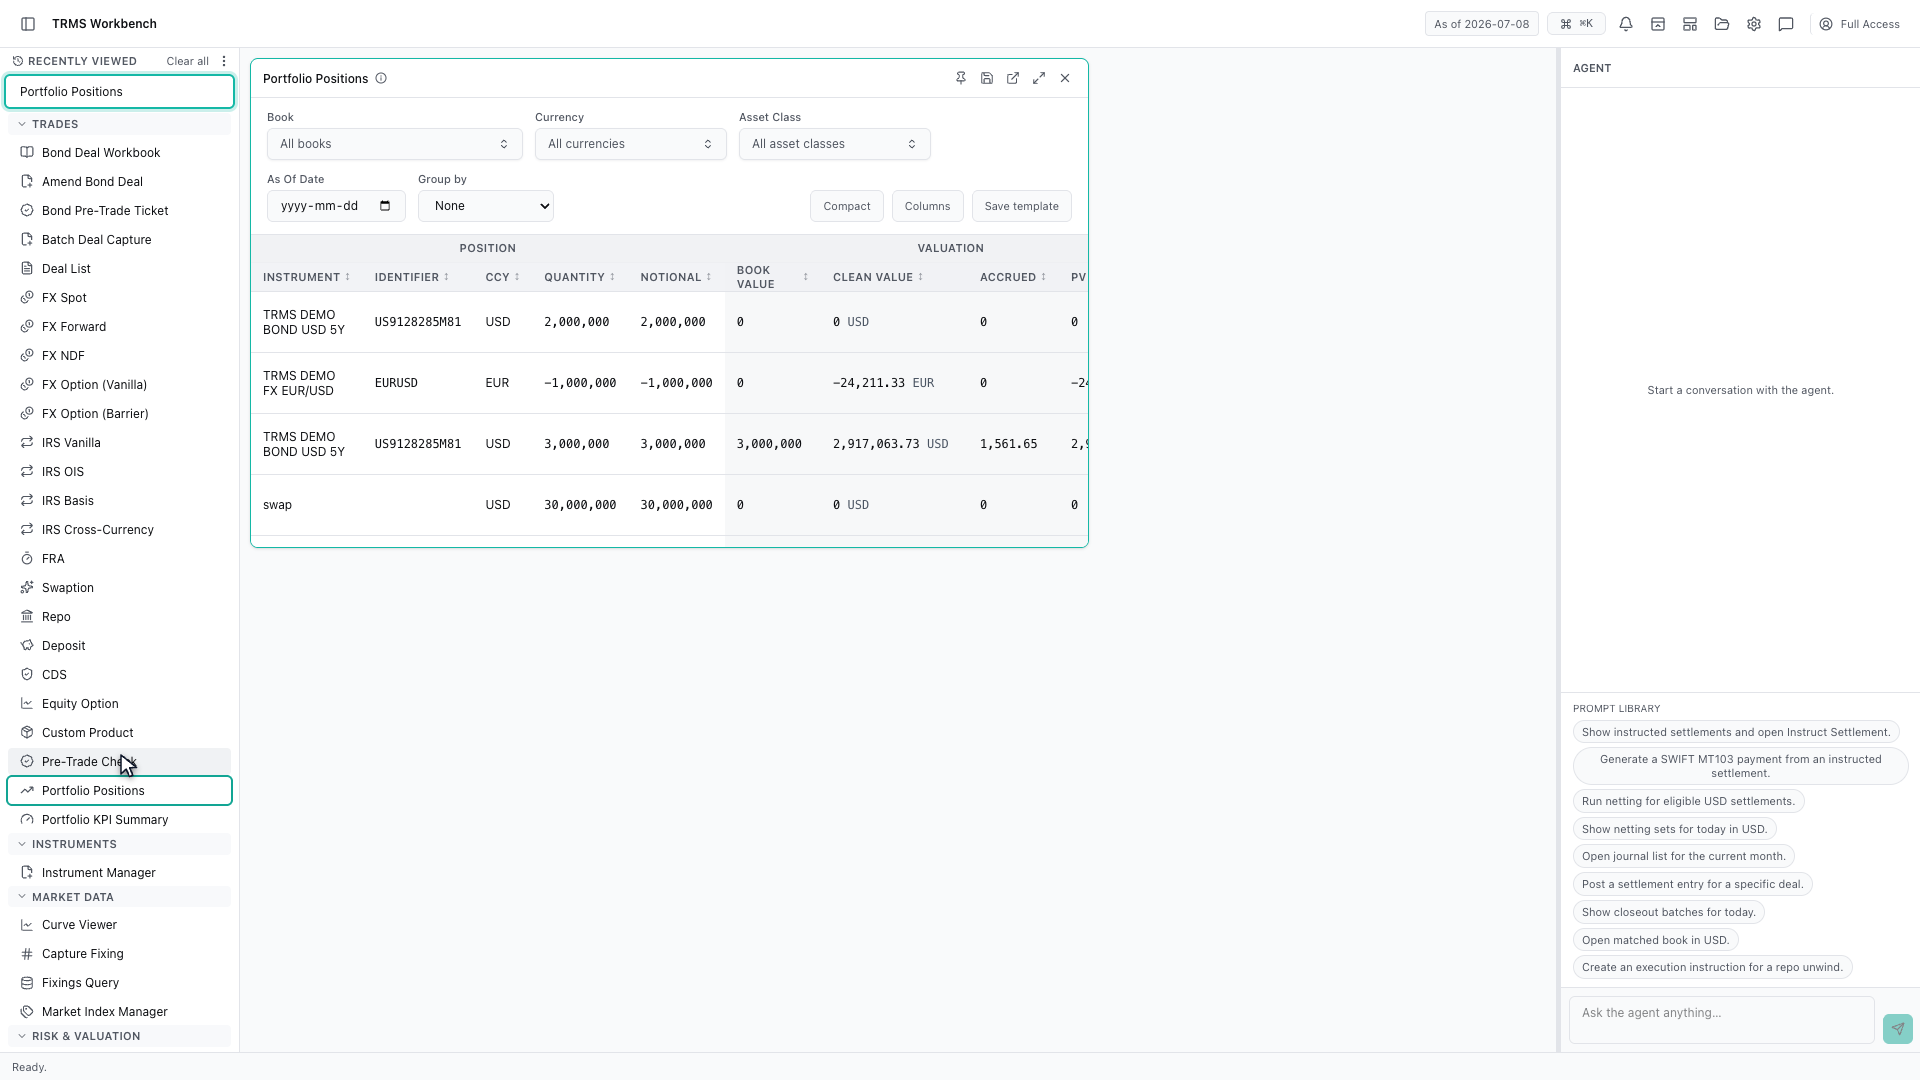
The columns come in bands. Position covers quantity and notional, Valuation covers what it is worth, and profit and loss sits beside it, so related numbers stay together as you scroll.
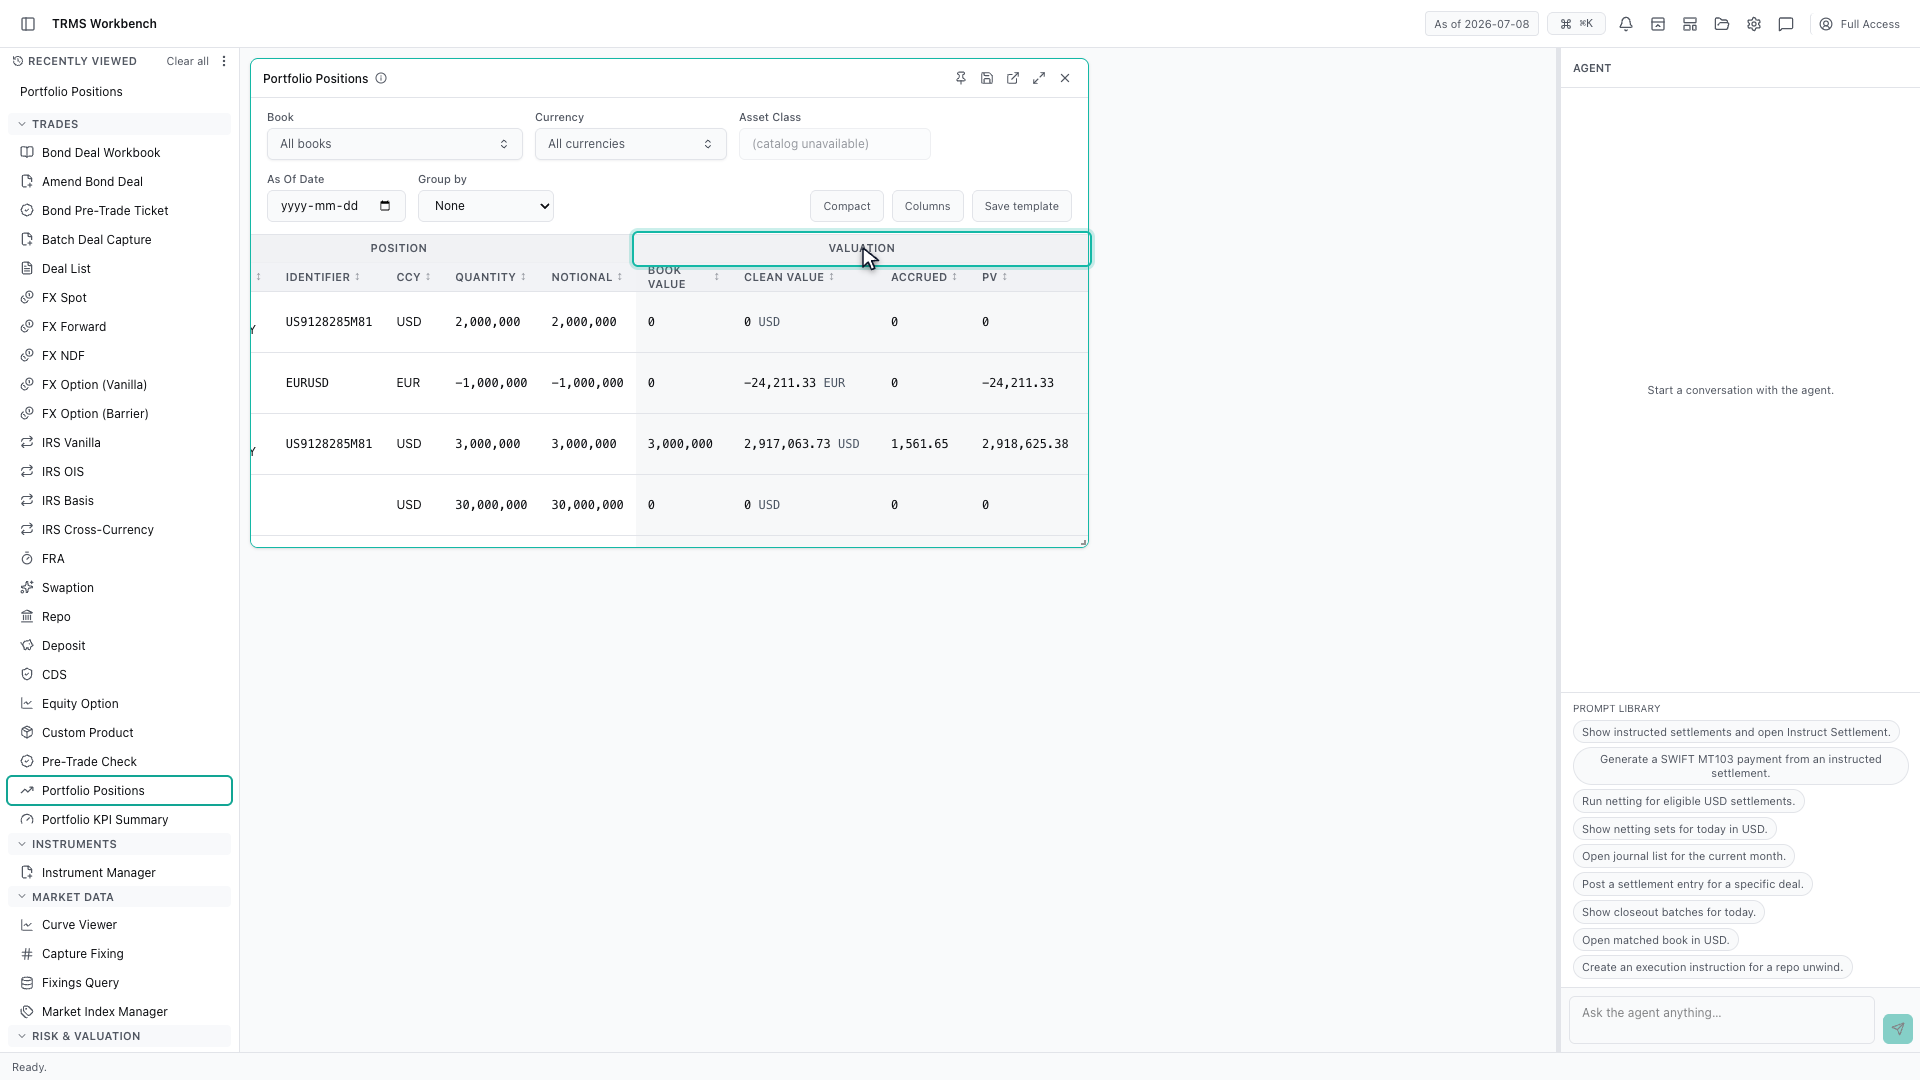
Book and currency narrow the view. Positions are aggregated across every book you can see, so filtering to one book is how you get to a single desk's exposure.
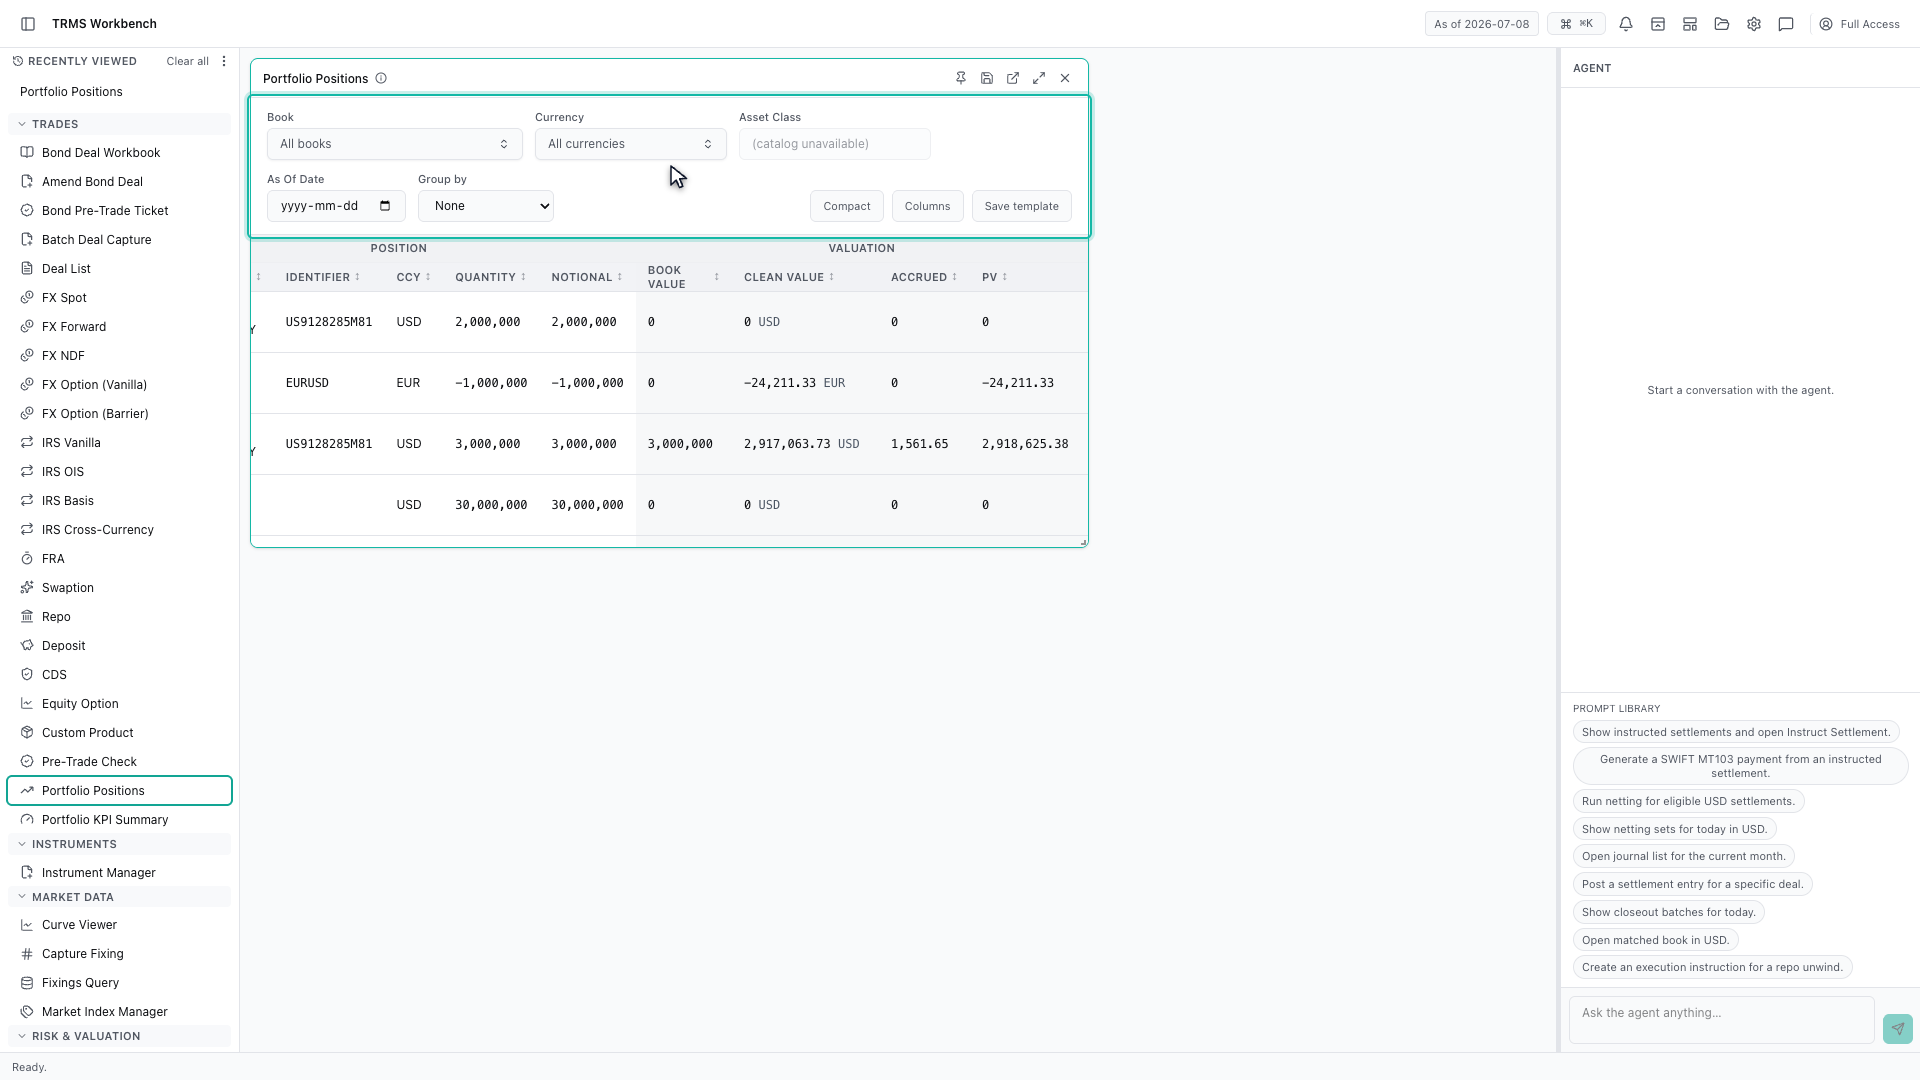
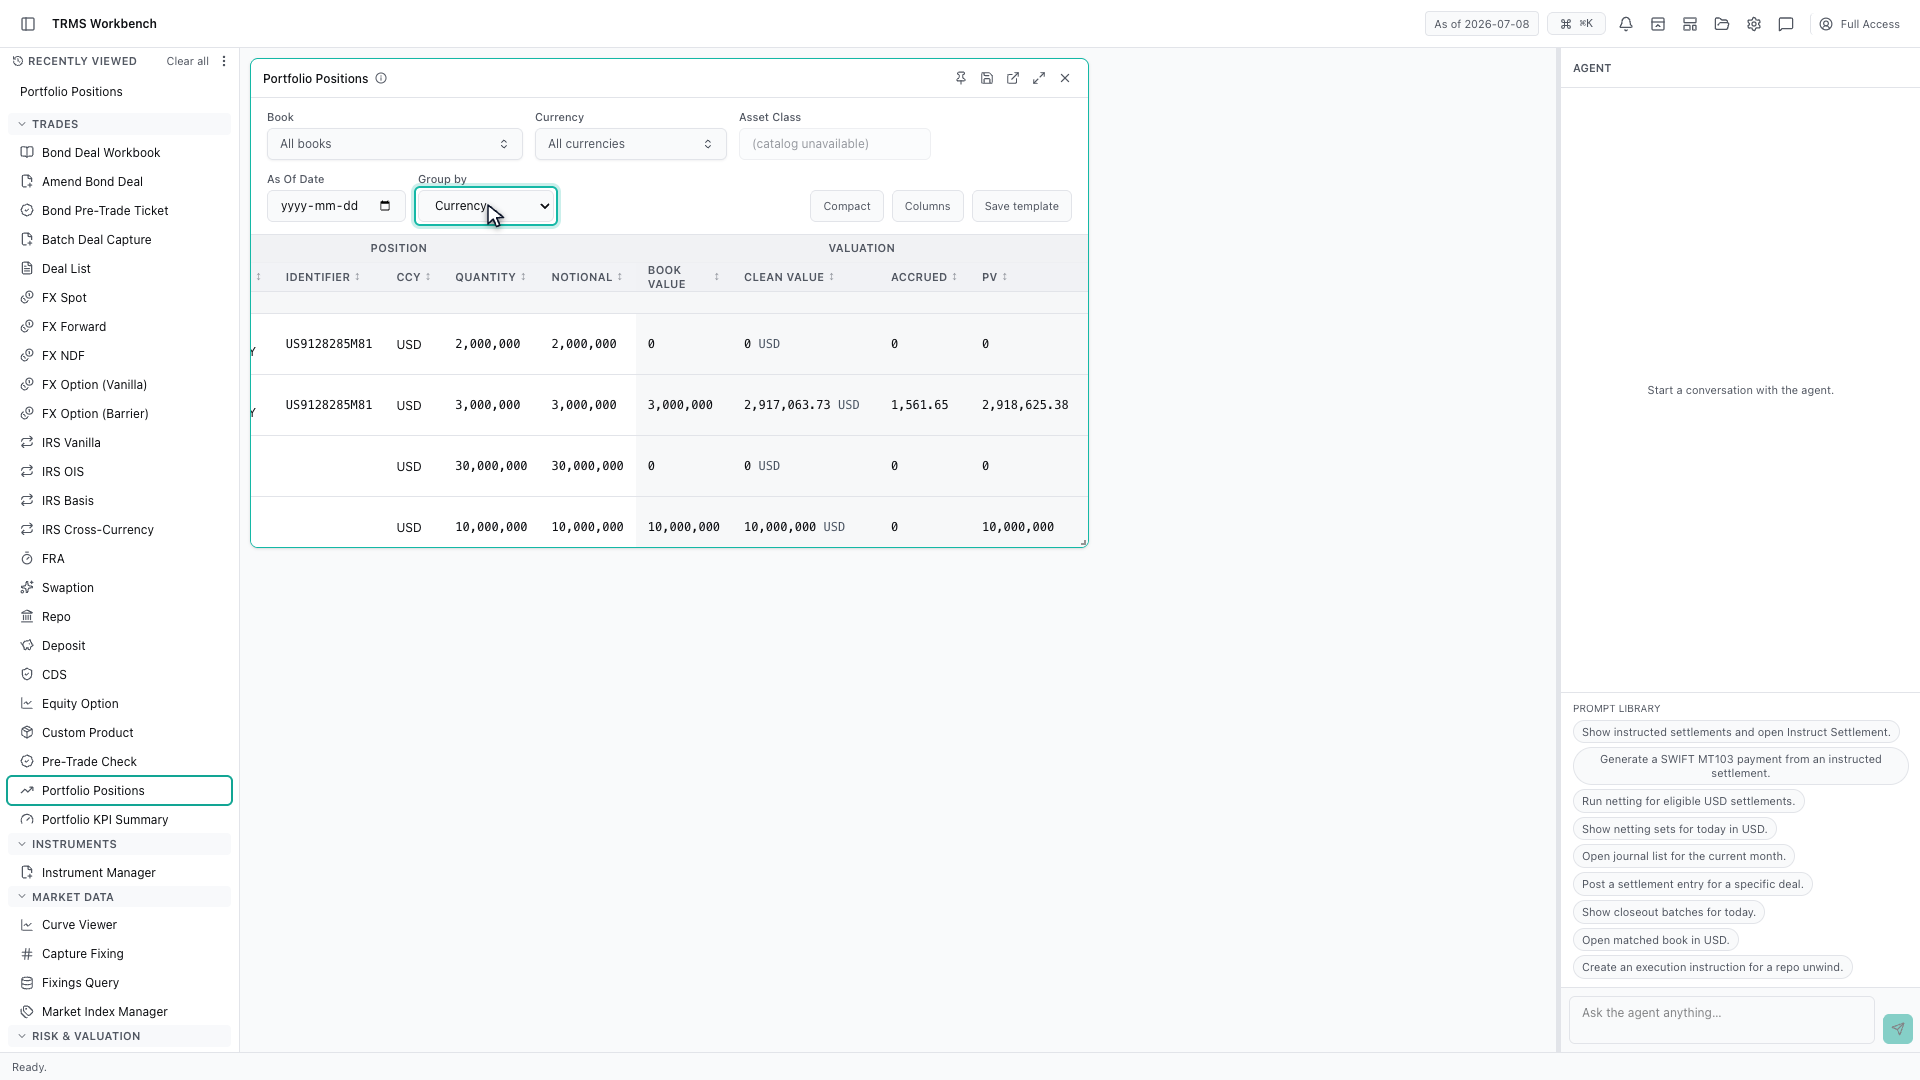
Group by changes the shape of the answer. Grouping by currency collapses the holdings into one parent row per currency, with the count beside it.
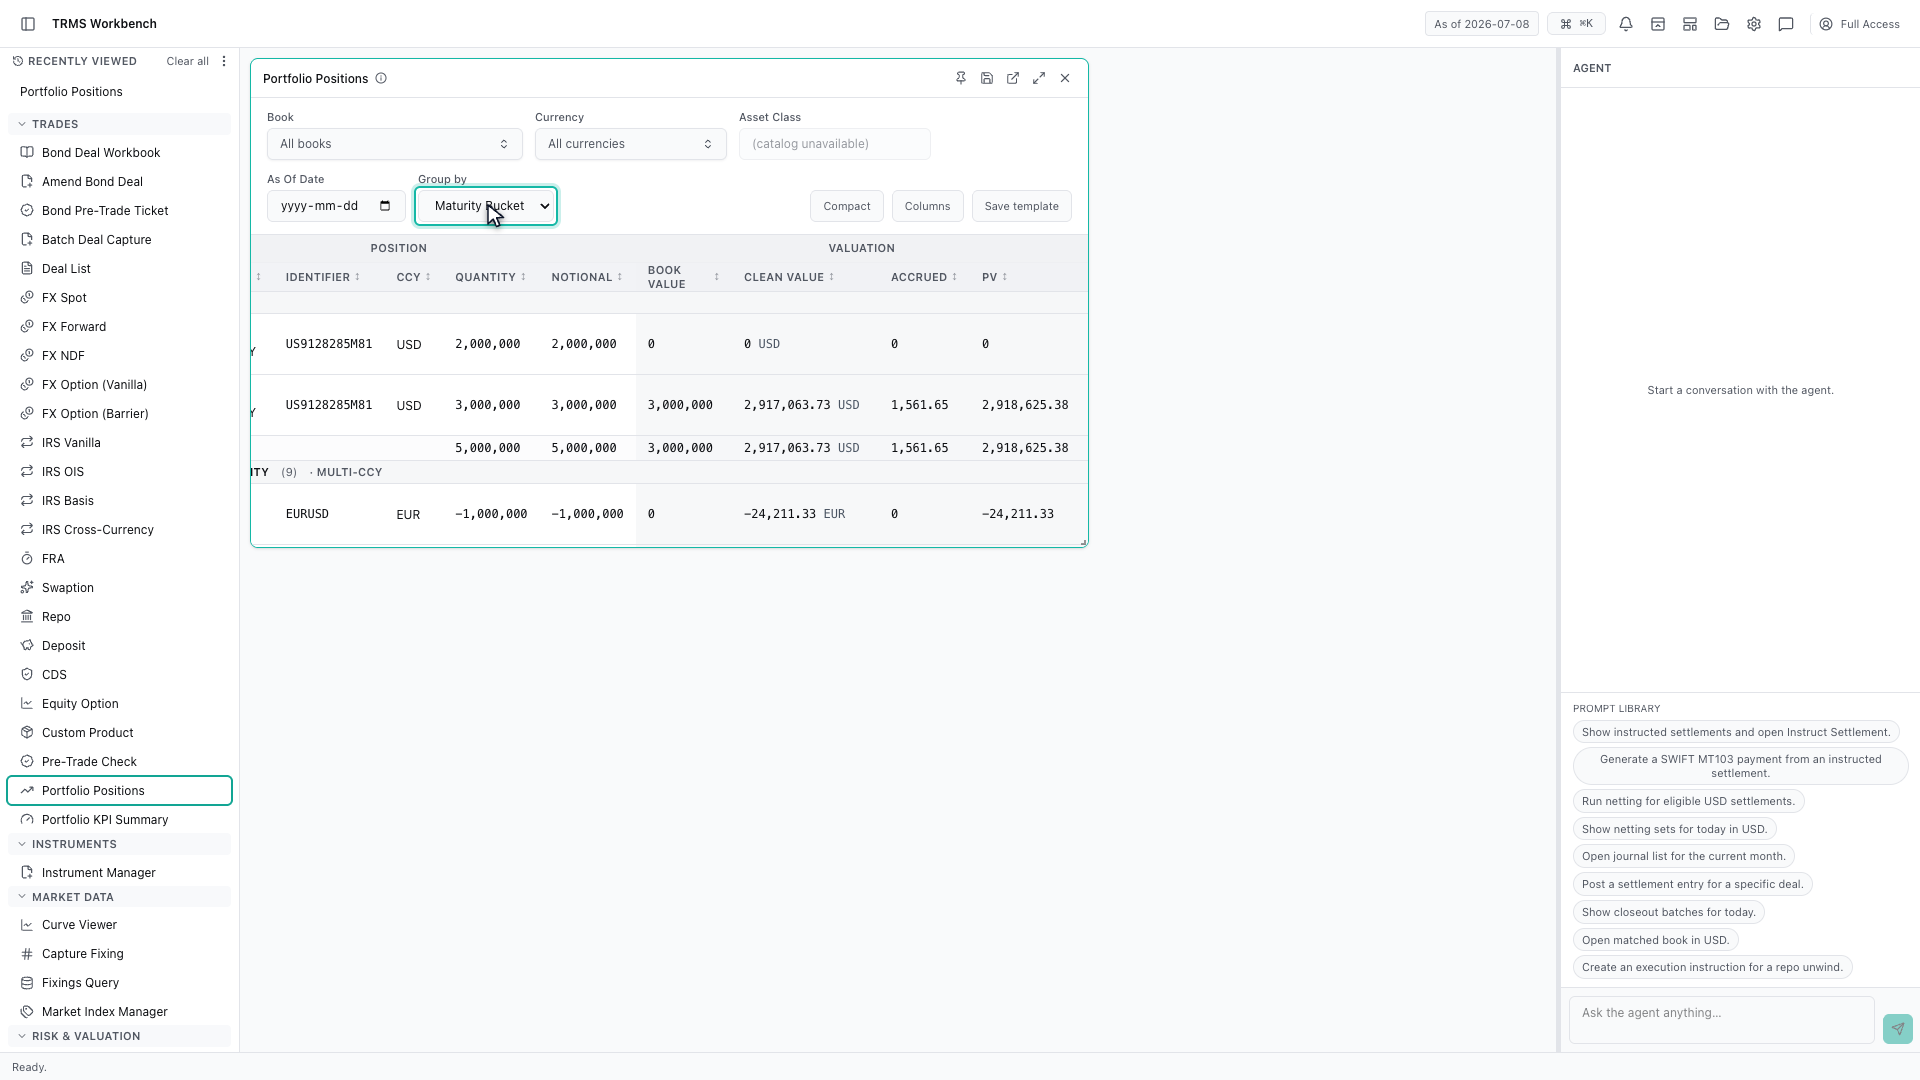
The same control groups by asset class, issuer, or maturity bucket instead — the last of these being how you see what is rolling off in the near term.
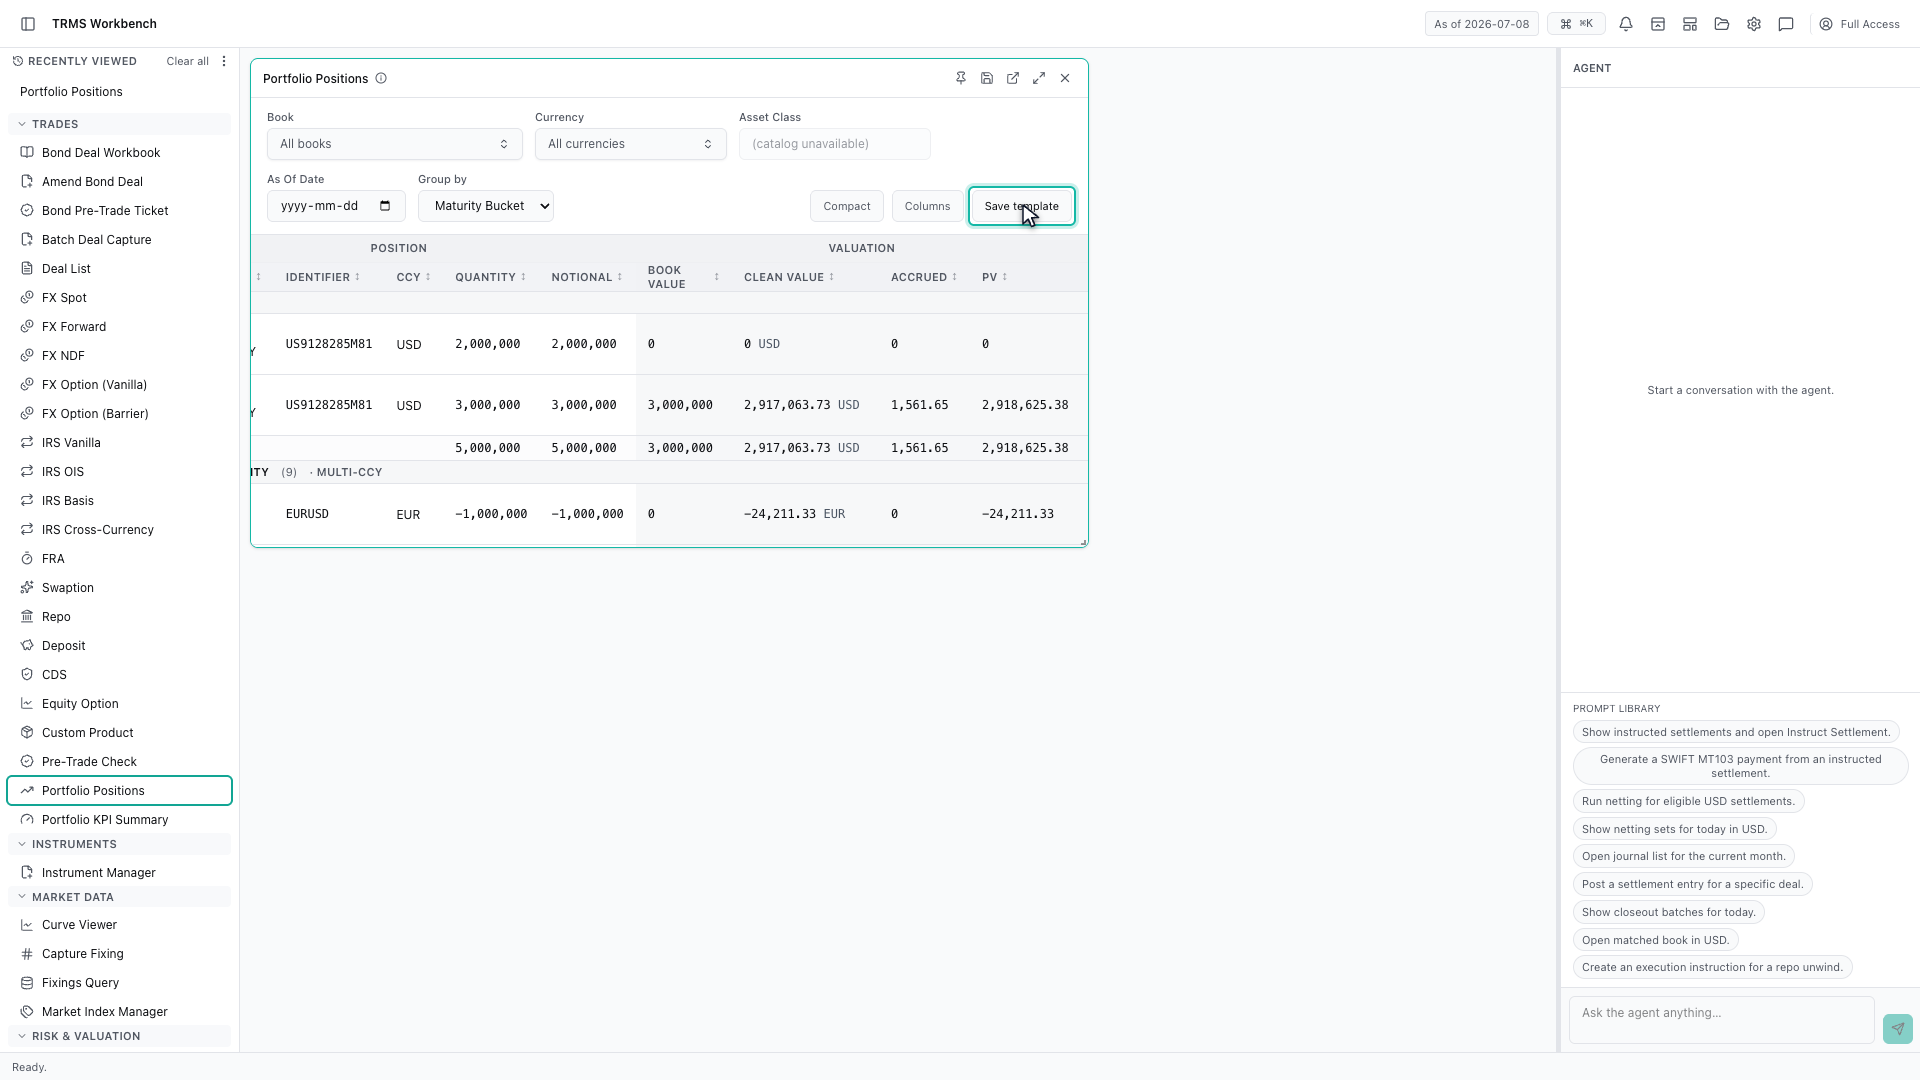
Compact tightens the rows when you want more of them on screen at once, and a view you have set up can be saved as a template to come back to.
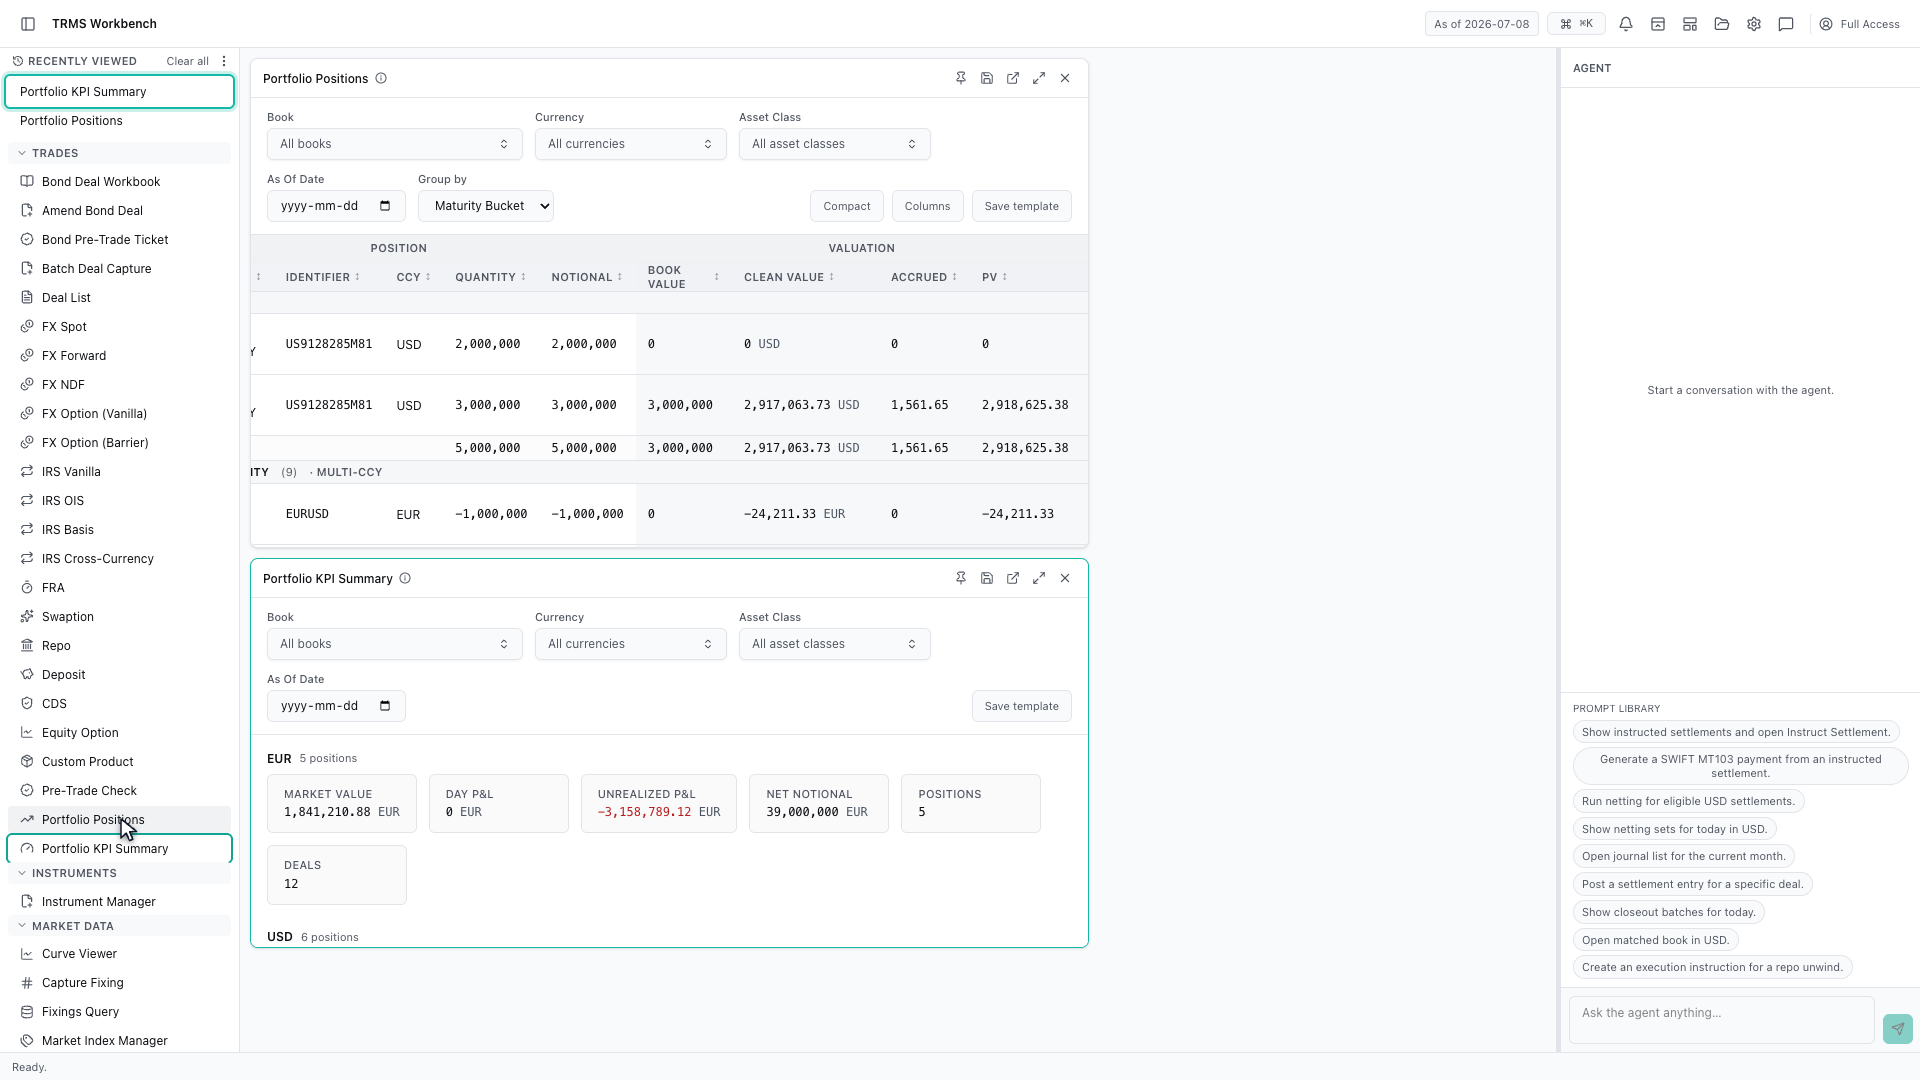
The KPI Summary answers the same question one level up. It takes the positions you just filtered and reduces them to a card per currency.
Each card carries market value, the day's profit and loss, unrealized profit and loss, net notional, and how many positions and deals sit behind it.
Because both surfaces share the same filters, the summary and the detail always describe the same set of positions. That is the pattern across the Workbench — work at the level you need, and drill down when a number looks wrong.
That completes Positions and Portfolio KPIs. Every surface shown here can also be opened from the agent panel on the right, by asking for it in plain English.
1. Open the Workbench
In this walkthrough we'll read your positions, group them, and see the portfolio summary, in the OpenTRMS Workbench.
2. Open Portfolio Positions
Portfolio Positions is not a list of trades. It is what those trades add up to — one row per instrument you hold, aggregated across books.
3. Columns are grouped into bands
The columns come in bands. Position covers quantity and notional, Valuation covers what it is worth, and profit and loss sits beside it, so related numbers stay together as you scroll.
4. Filter by book and currency
Book and currency narrow the view. Positions are aggregated across every book you can see, so filtering to one book is how you get to a single desk's exposure.
5. Group by currency
Group by changes the shape of the answer. Grouping by currency collapses the holdings into one parent row per currency, with the count beside it.
6. Group by another dimension
The same control groups by asset class, issuer, or maturity bucket instead — the last of these being how you see what is rolling off in the near term.
7. Density and saved templates
Compact tightens the rows when you want more of them on screen at once, and a view you have set up can be saved as a template to come back to.
8. Open the KPI Summary
The KPI Summary answers the same question one level up. It takes the positions you just filtered and reduces them to a card per currency.
9. Read a currency card
Each card carries market value, the day's profit and loss, unrealized profit and loss, net notional, and how many positions and deals sit behind it.
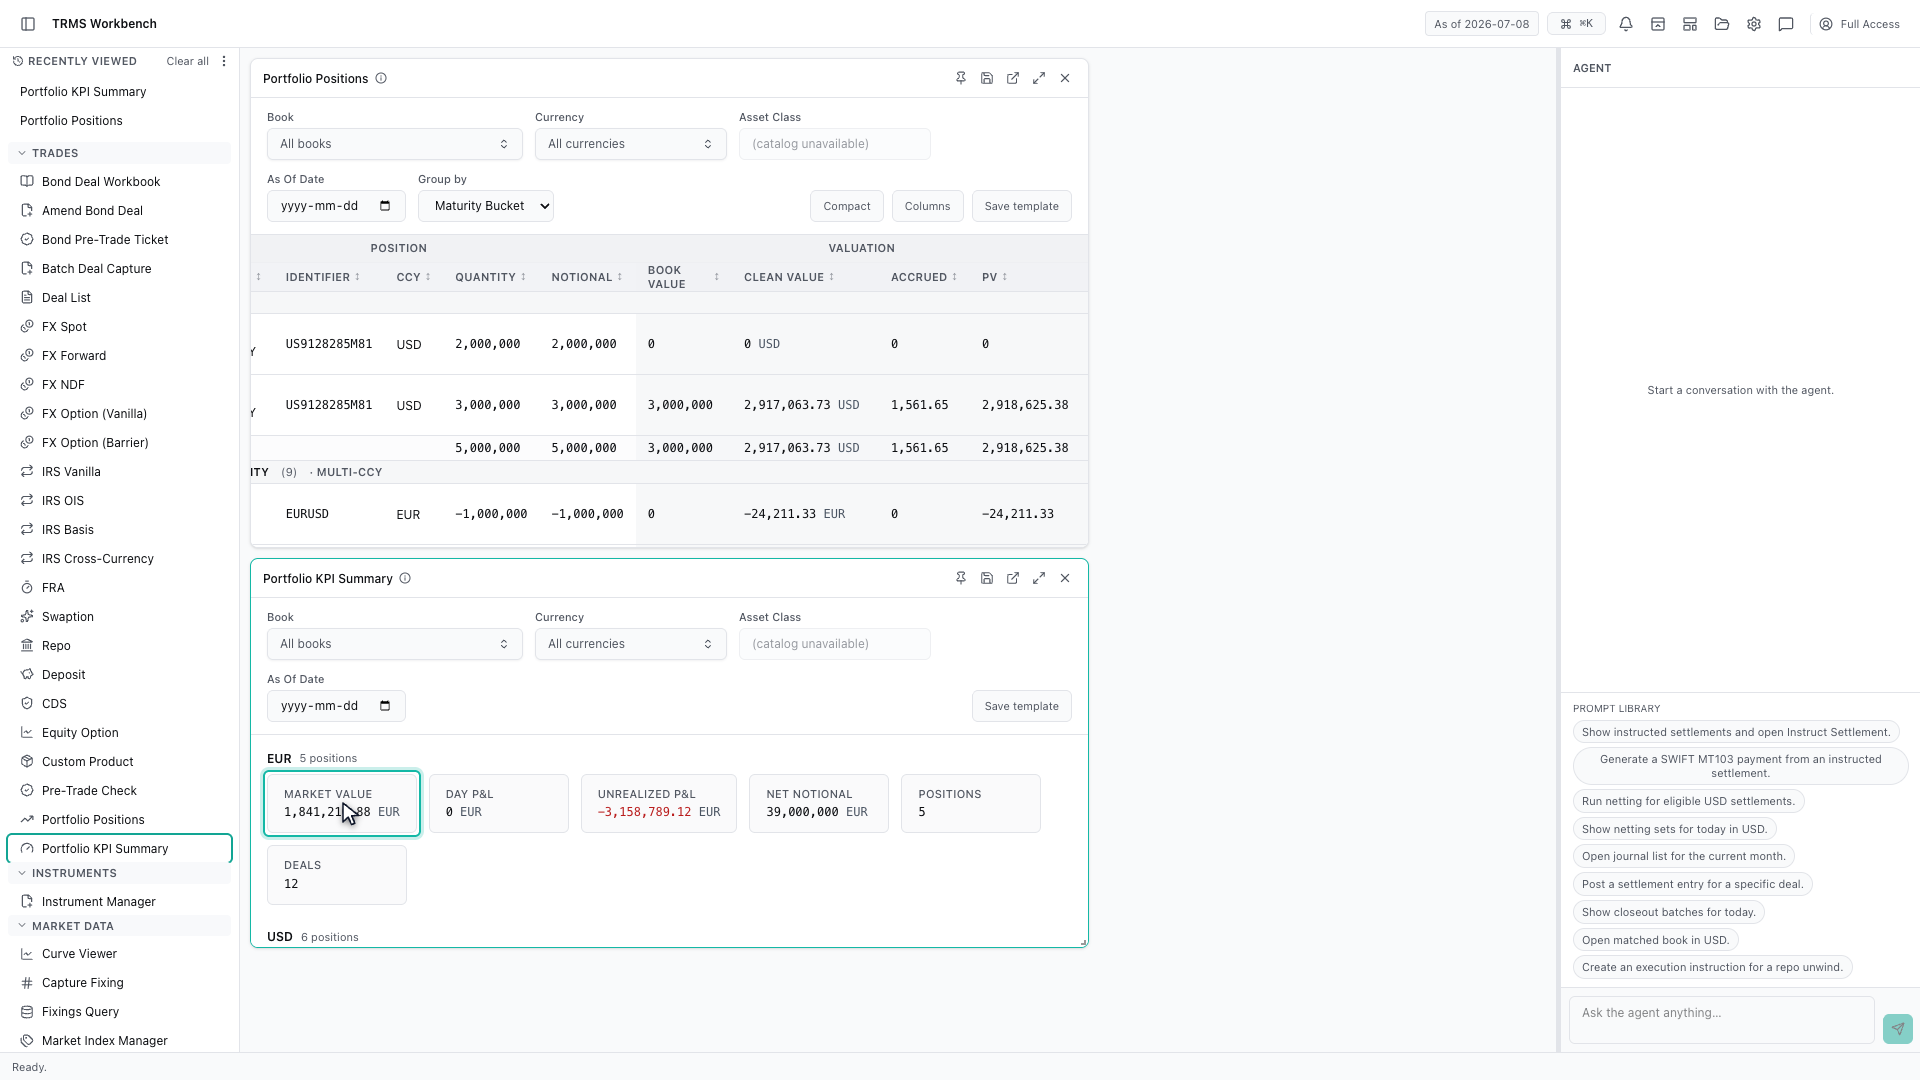
10. Summary and detail stay in step
Because both surfaces share the same filters, the summary and the detail always describe the same set of positions. That is the pattern across the Workbench — work at the level you need, and drill down when a number looks wrong.
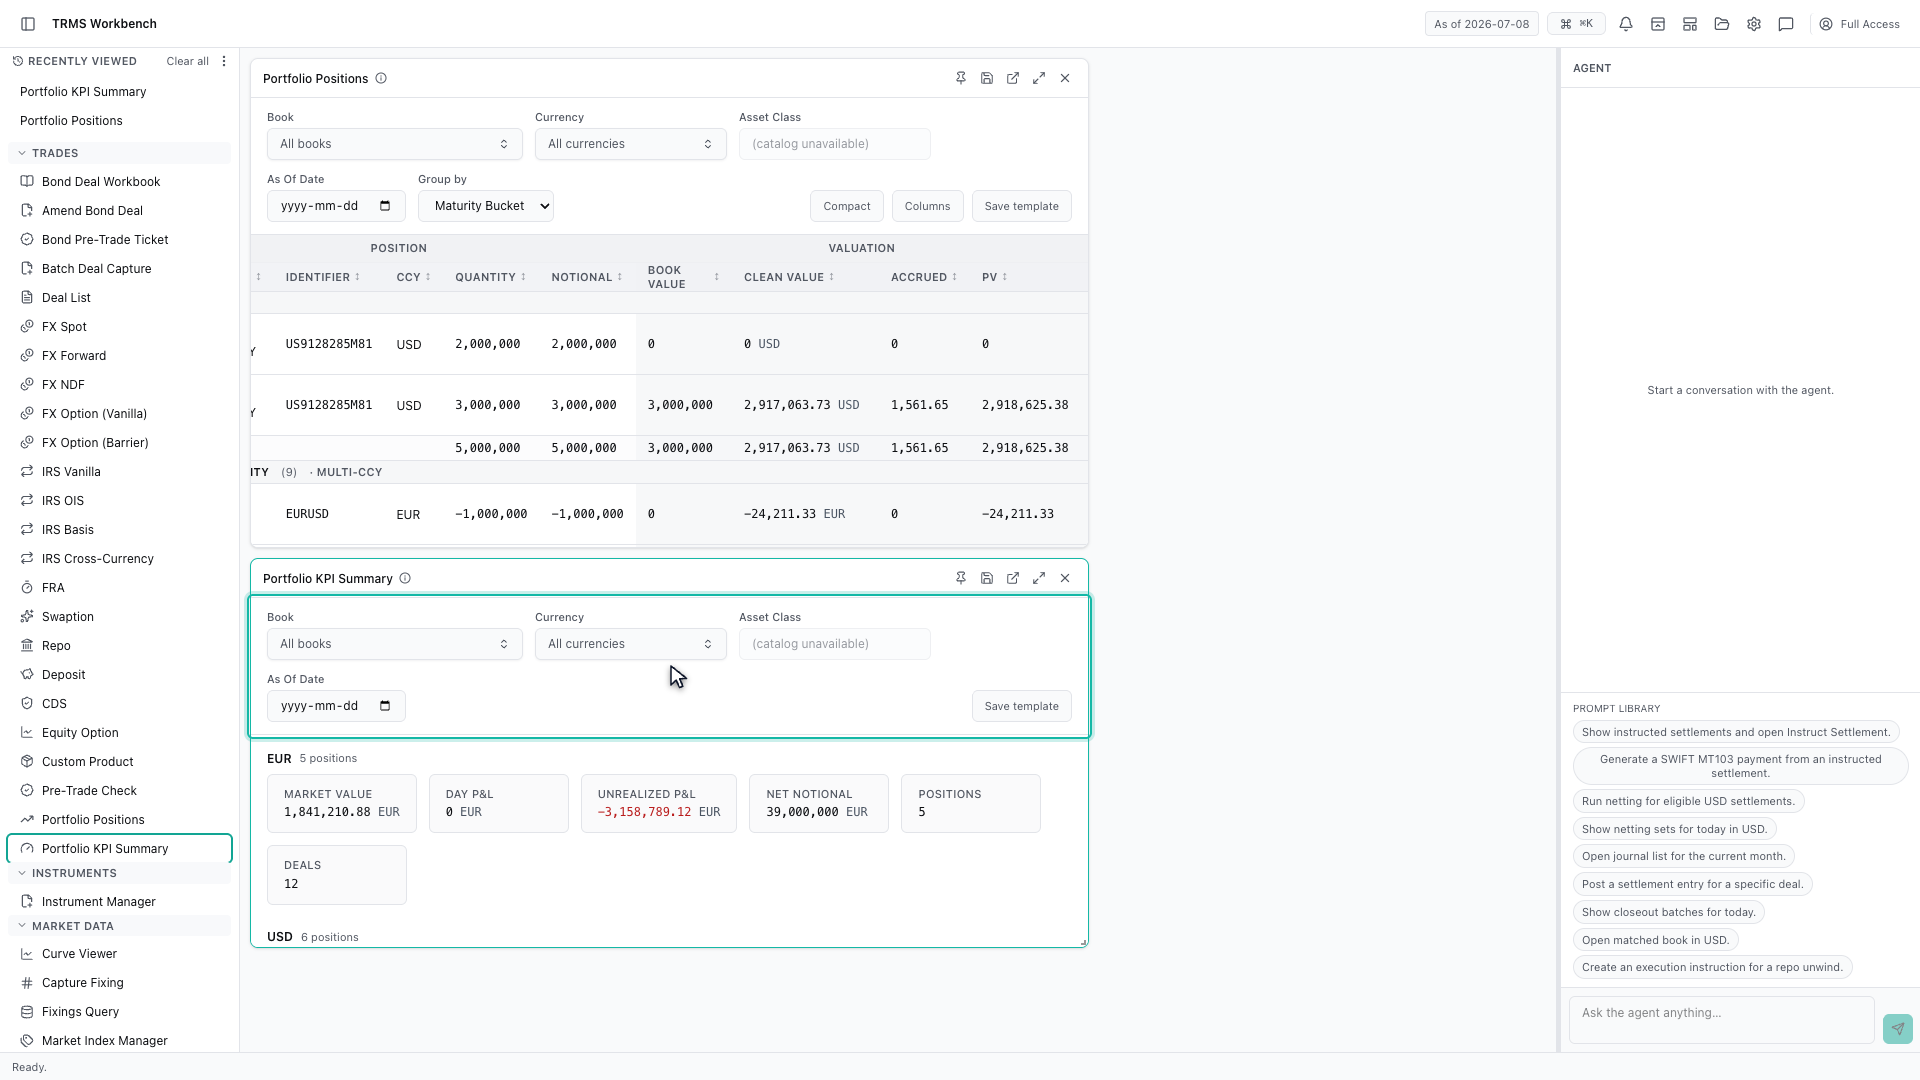
11. Next steps
That completes Positions and Portfolio KPIs. Every surface shown here can also be opened from the agent panel on the right, by asking for it in plain English.